Coronavirus: How This May End for Oil Prices

On February 11, I predicted that Coronavirus would crush oil prices. Prices collapsed on February 20. Today, prices have reversed and WTI price is $2.00 higher on expectations of an OPEC+ production cut and central bank stimulus. Rising and falling sentiment about Coronavirus will be the framework for the rest of 2020.
As of last Friday, WTI prices had fallen 27% and Brent had fallen 15% since late December. Price increased on Monday, March 2 but oil price is being devalued despite today’s gains. Most of this is because of lower demand expectations and disruption of supply chains from Coronavirus (Covid-19).
Hope versus reality will be the manic pattern for 2020. The optimistic rebound of price during the week ending February 14 was short-lived and turned to capitulation the following week. WTI price dropped $8.62 and Brent fell $7.98 (Figure 1).
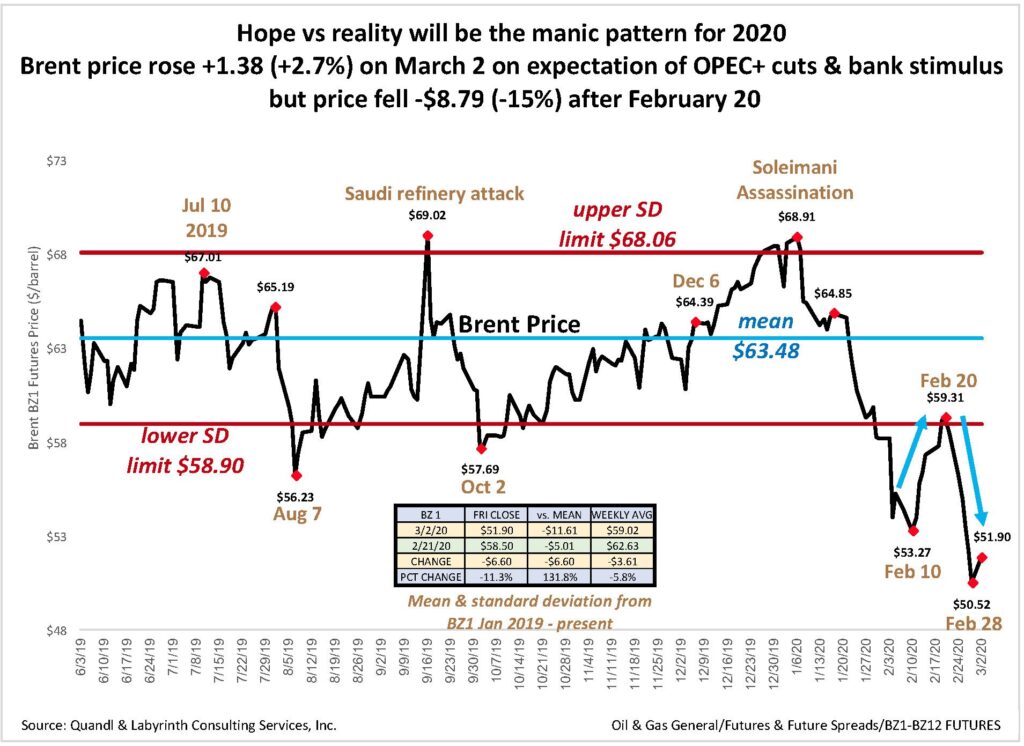
but price fell -$8.79 (-15%) after February 20. Source: Quandl and Labyrinth Consulting Services, Inc.
On March 2, Brent price rose by $1.38 (2.7%) on expectation of OPEC+ production cuts and central bank stimulus plans but longer market players aren’t buying false hope. Brent 12-month spreads fell 94% deeper into contango (Figure 2).
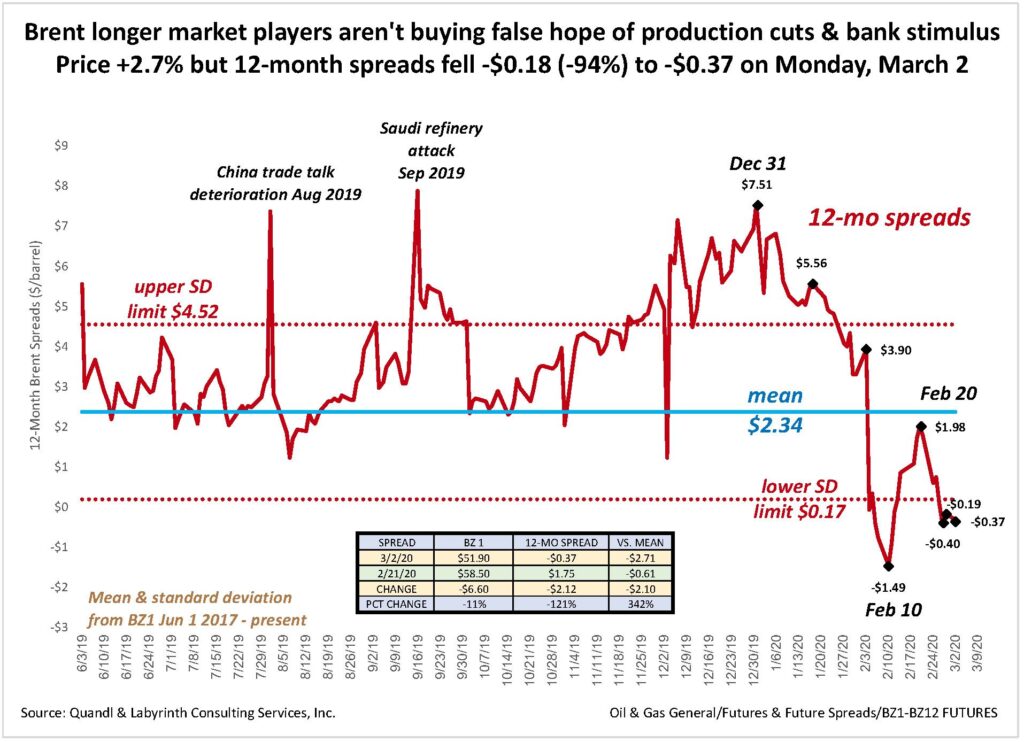
Markets seem to be reflecting two contrasting themes . Collapsing prices are recovering based on hope but spreads are more faithfully reflecting market fundamentals namely, that demand destruction cannot be fixed with bandaids. The worst effects of the Coronavirus on oil markets persist although may not be quite as serious as originally thought in early February.
As consensus builds toward Coronavirus apocalypse, short-term oil traders can easily find counter-parties to take the other side of a bet that prices will probably improve over the term of a contract. This pushes prompt contract prices down. Meanwhile, longer-term players may be able to see their way clear to an upturn in prices later in 2020 or in 2021 but for now, they recognize that neither OPEC+ nor central bankers can make the economic effects of Coronavirus magically disappear.
While the news about Coronavirus and its effect on oil markets is bad, there are some hopeful elements that may explain how markets are reacting now. Figure 3 shows that the number of cases in China appears to be leveling off and that people who have recovered is increasing. The scale of the chart under-states the expansion of cases outside of China. Still, the data suggests that fears of an apocalyptic pandemic may be exaggerated.
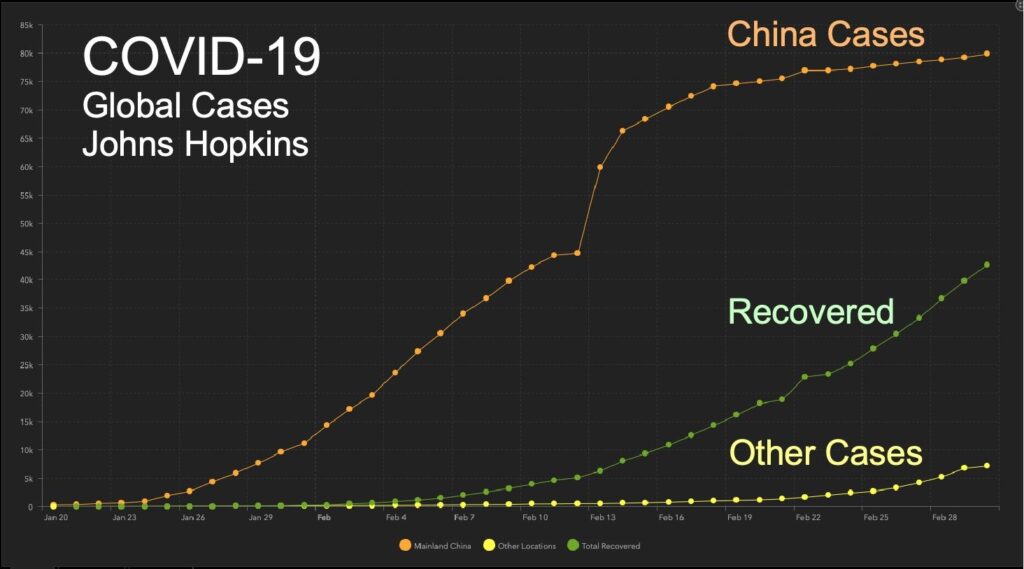
At the same time, Chinese data is suspect and confirmed cases are rising quickly outside China. Some people are returning to work in China but baseball stadiums are empty in Japan and Italy is looking a lot like the China of two weeks ago with quarantines and growing concerns.
Negative world demand growth is likely for 2020 (Figure 4). This optimistically assumes that only demand from China is affected and that a decrease of 200 million barrels for the first quarter is followed by recovery in the rest of 2020.
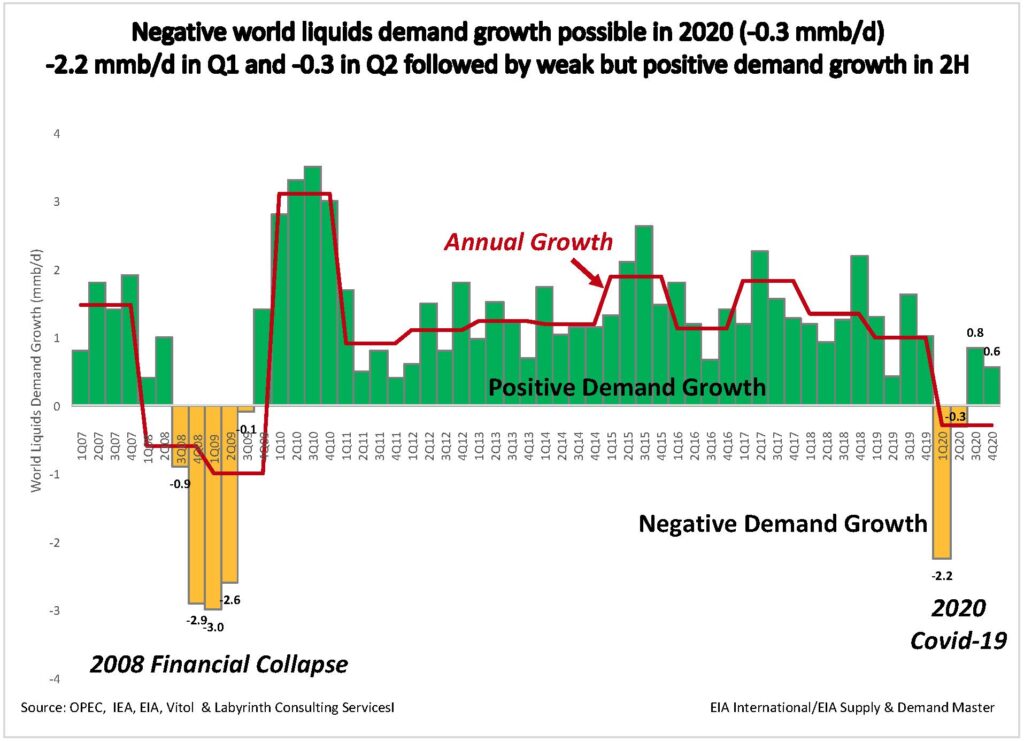
in the second quarter followed by weak but positive demand growth in the second half of 2020.
Source: OPEC, EIA, Vitol and Labyrinth Consulting Services, Inc.
That would result in the first quarter of negative demand growth since the 2008 Financial Collapse and the first year of negative demand growth since 2009. The “knock-on” effects of broken supply chains and demand destruction outside of China would result in an even more pessimistic, if more probable, forecast. In either case, it is unlikely that oil prices will recover substantially from current levels in 2020 or that Coronavirus will become a distant memory.
The near term is anyone’s guess at the moment but it is probable that the panic will be worse than the pandemic. I can imagine a scenario in which prices continue to fall from current levels but start to stabilze.
Comparative inventory suggests than the current WTI front-month price of about $47 is under-valued by at least $8 per barrel. I don’t believe that sentiment alone is responsible for this. Markets are assuming a substantial inventory build once lower demand begins to affect shipments at least for U.S. stocks. The price is still under-valued because inventory build will probably be more gradual than price anticipates.
I can also imagine a scenario in which panic drags near-term prices into the $30 to $40 range. That would probably not be sustainable for very long.
Whatever the short term brings, WTI prices should stabilize in the low- to mid-$50 range sooner than later, and move slowly higher as the emerging effect of Coronavirus on oil markets and the economy becomes clearer. Once this happens, prices will rise and fall on daily news that is either more or less hopeful about the impact of Coronavirus on demand and supply chains. That period of flux may last for 18 months or longer.
Like Art's Work?

Share this Post:
Read More Posts
Hey Art – It looks like things are playing out just like you had expected they would.
The question is; where do we go from here?
Will NA producer budget cuts be enough to slow production growth and move prices higher; or will coronavirus fear drag prices lower?
And what impact do you think the increased Saudi production will have (if they are even capable of more production?)
Excellent article, as always!
TJ
Supply could seriously restrained with lack of financing
Everyone focus is on the demand side
The supply side could be seriously reduced
To create higher prices
Price charts for WTI indicate much higher prices
There is something there that know one understands
Richard,
I completely agree that supply, not demand, ordinarily drives oil and gas markets. The exception is during serious economic recessions when people don’t have the money to pay for many forms of oil consumption. The present situation is unique because demand is driven by enforced low economic activity because of coronavirus. That in turn is driving recession or depression so the outcome is the same. Demand is the key factor. Supply is the solution.
Best,
Art
The negative demand growth bar is looking prescient one week after the fact. The Saudis, especially the Russians are going to inflict massive pain on the US economy for years of abuse and sanctions. People thought the Russians interfered in the last election, well, no incumbent president has survived a recession or oil price shock. Now both are going to happen along with a COVID-19 slaughter of the elderly. This election could be epic, an Act-of-God, Hollywood blockbuster staring Keanu Reeves and Will Smith, with a Russian ‘invasion’ thrown in just for giggles.
The blood bath in my native Alberta should finally come. After hiding behind a complaisant CONservative regime for the past 50 years the mounting $125 billion losses in the Tar Sands can’t be hidden. Nor can the government figures that state $75 to $85 per barrel is break even for mining. Insitu steam generated bitumen is merely $45 to $55 per barrel. For fun, I added all the royalties, net revenue, and return allowance figures together, then divided accumulated losses by that number. For the largest and medium companies the number was equivalent to needing roughly 4 years to retire the debt. The worst companies took 100 years to retire their debt. ‘Return Allowance’ is the agreed return on invested capital based on Bank of Canada Long term Interest rates of approximately 2.75%. So Tar Sands companies are getting roughly 2.2% return on their losses. Alberta recently introduced a ‘Modernized Royalty Framework’ that sets royalties at a base of 5%. This was the rate taken in Great depression 1930 when the industry began operating. And you thought the people running AIG circa 2006 were dim-witted and blind to events.
Richard,
Thanks for your observations on the situation in Canada. Always appreciated,
Art
Thank you sir great analysis
Thank you!
thank you Art Berman
Hi Art, the oil price has made a partial recovery from the free fall of a day prior. But I find it hard to believe a sustained recovery is possible in the short term. Isn’t it more likely that in the coming month we will see a further plunge toward $25 on WTI than a recovery to $40 ?
Really appreciate your sage analysis over the years btw
Art, you need to update this in light of the OPEC+ negotiations collapse, and WTI’s newest collapse on the heels of that.
Thanks Art, great analysis as always.
Thanks, Mark!
Art
I doubt that but we will see. I don’t think markets have much faith in CBs for oil prices these days. Momentary buzz, then cold reality.
Best,
Art
Thanks, Drew!
All the best,
Art
Excellent, comprehensive and rational assessment. Thank you, Art
Generally agree but I believe that the likely fiscal and monetary pumping coupled with OPEC costs could cause a sudden spike in oil prices mid-year