Art Berman Newsletter: December 2022 (2022-10)

WTI price was above $92 on November 4 and closed less than $75 on December 6. Brent closed below $80 for the first time since January 3.
What’s happening now in oil markets is probably a squeeze in which traders are unwinding their long positions, and it should pass. That said, it has all the signs of a price collapse. Whatever the explanations, structural changes are being reflected beyond the ordinary interplay between fundamentals and sentiment.
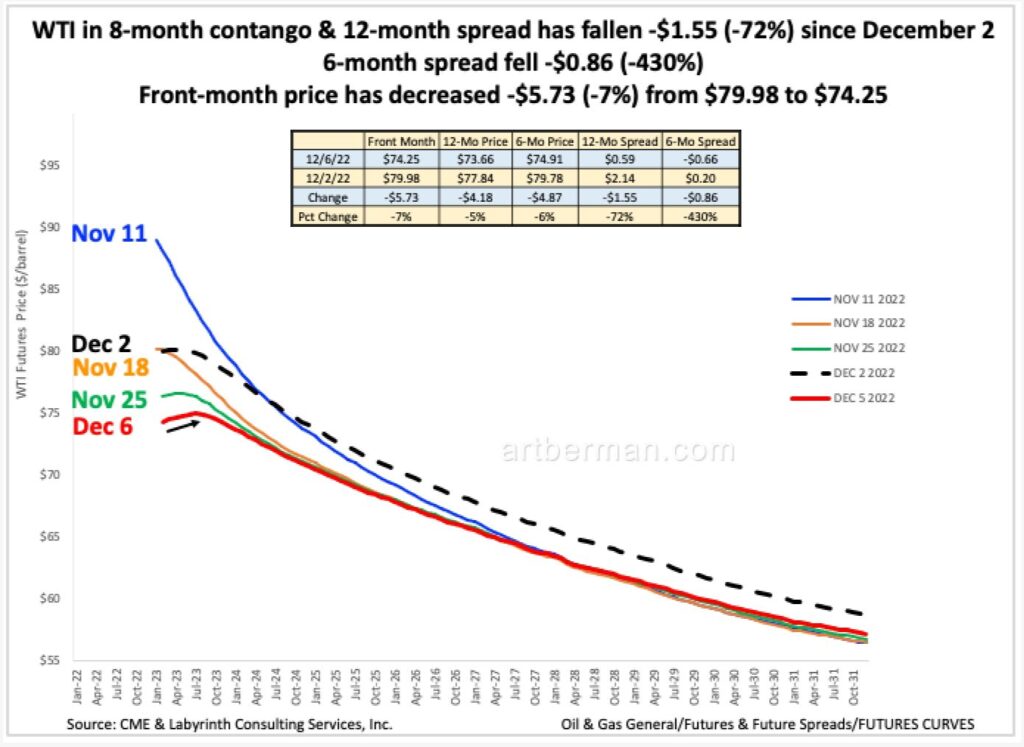
The 12-month spread between the WTI January and December 2023 contracts has fallen -$1.55 (-72%) since last Friday, December 2 to its lowest level since December 2020. WTI went from 3-month contango last Friday to 8-month contango on Tuesday, December 6 (Figure 1).
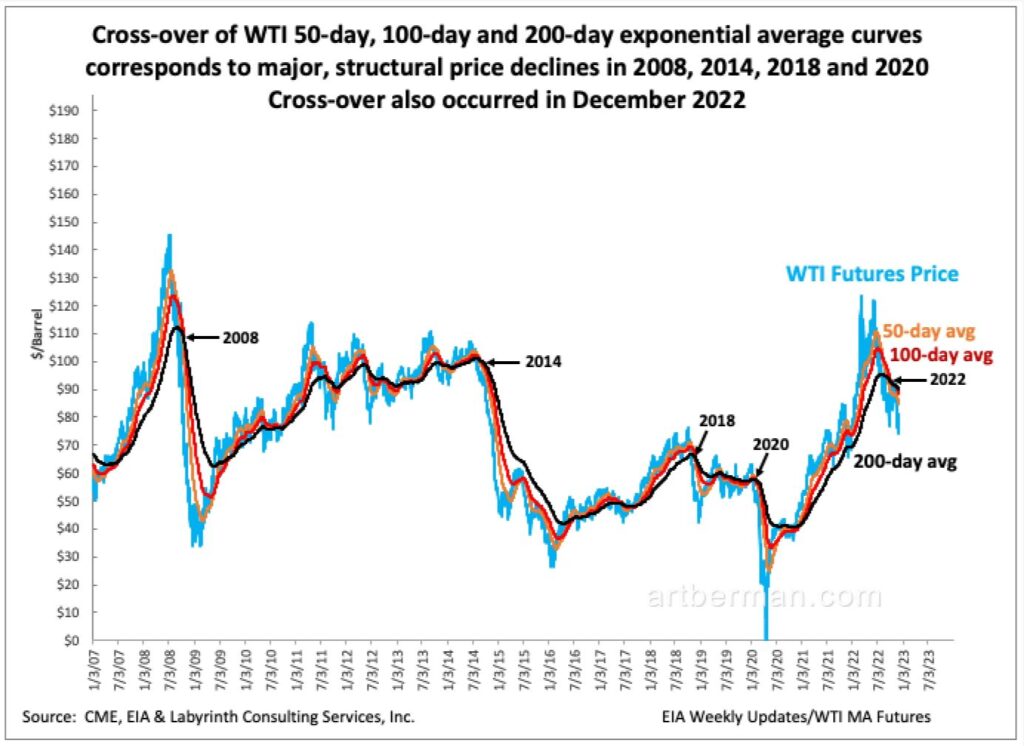
Cross-over of WTI 50-day, 100-day and 200-day exponential average curves corresponds to major, structural price declines in 2008, 2014, 2018 and 2020. Cross-over also occurred in December 2022 (Figure 2).
Analysts have been offering a daily chorus about “incredibly tight markets” for most of 2022. For awhile, it seemed reasonable. Certainly the Russian invasion of Ukraine created extraordinary market dislocations that pushed energy prices to 10-year highs. But for 75% of the time since June 15, WTI price has been less than its 20-day average (Figure 3).
Only OPEC’s threat to cut production in late August (‘ABS Cut Comment’ in Figure 3) and subsequent delivery on that threat in early October (‘OPEC+ Cut Oct 5’ in Figure 3) lifted prices above that threshold before the descent that began on November 4.
Price has fallen -$18.36 (-20%) since November 4 and has decreased -$5.73 (-7%) from $79.98 to $74.25 since last Friday, December 2

Two weeks ago, Goldman Sachs forecasted an average Brent-price of $100 for the fourth quarter of 2023. At that time, Brent needed to average $110 for the rest of the year to reach $100. Since then, it’s averaged $84. As of December 2, Brent needed to average $118 for the rest of the year to reach an average of $100. That’s not going to happen.
Goldman’s call should be dismissed as misleading and irresponsible. In other words, they are pitching their book.
Things Are Not Returning to Normal
The 2020 global pandemic was a watershed event that completed a paradigm change for oil markets that began with the Financial Collapse of 2008.
Analysts imagine that things are returning to normal. After all, oil demand must return to and exceed pre-pandemic levels because it is a vital component of economic growth. I agree except that economic growth is a preference, and not a law of nature.
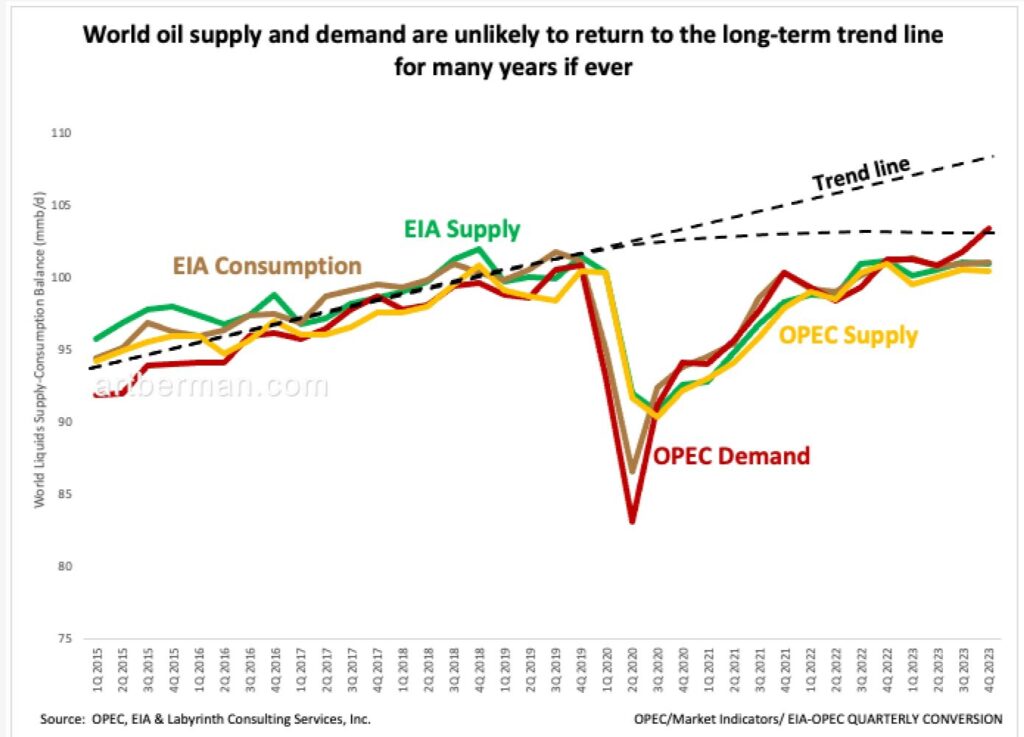
World oil supply and demand are unlikely to return to their long-term trend-lines in 2023 (Figure 4). That has potentially profound implications. World oil demand may return to pre-pandemic highs in 2023 but supply is less likely to reach previous levels.
Oil bulls point to the implied supply-demand deficit because of that as a reason for much higher oil prices. They fail to recognize that markets are supply-driven and that demand is likely to adjust to meet lower supply.
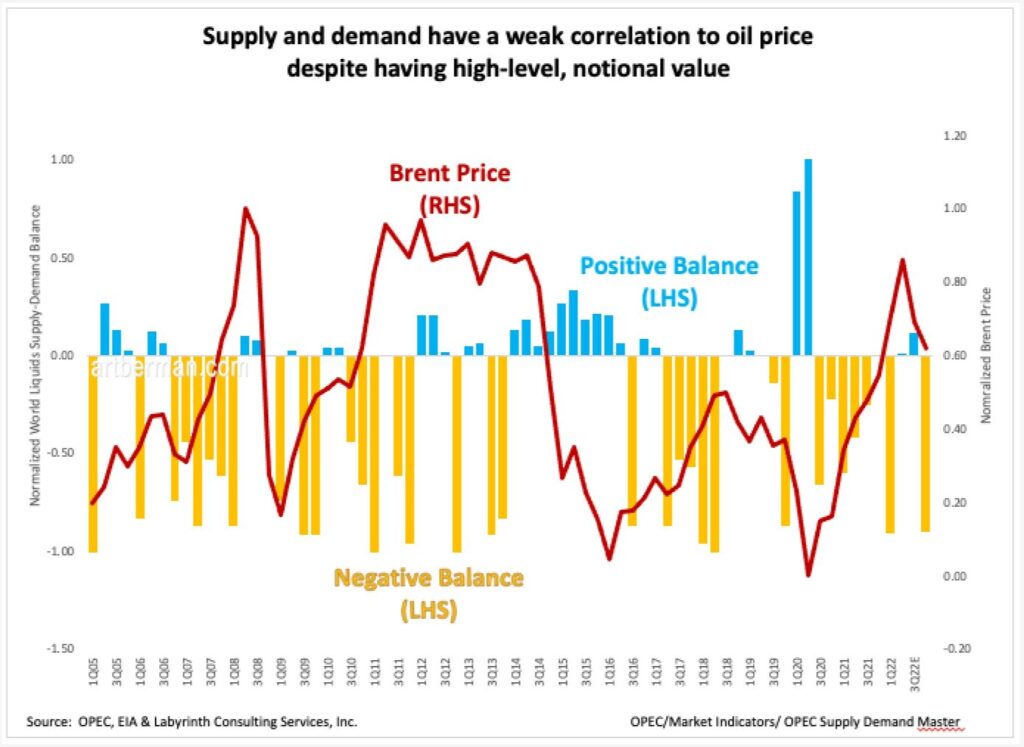
Moreover, supply and demand are poor predictors of oil price. Figure 5 shows the normalized supply-demand balance for world liquids since 2005, and normalized Brent price. There is only a weak correlation between periods of surplus or deficit and price. In other words, there are times of large supply-demand deficits during which oil prices are relatively high, but other times of large deficits during which oil prices are relatively low. That’s because the supply-demand balance is only one factor that controls oil price.
Part of the problem is that supply and demand are at best gross estimates. It is impossible to integrate every nation’s production, consumption and exports into a single framework. The data simply doesn’t exist. More importantly, supply and demand are transactional factors that largely exclude storage. Trying to predict price based on the supply-demand balance is like trying to evaluate a person’s net worth based on income and expenditures without considering investments and savings.
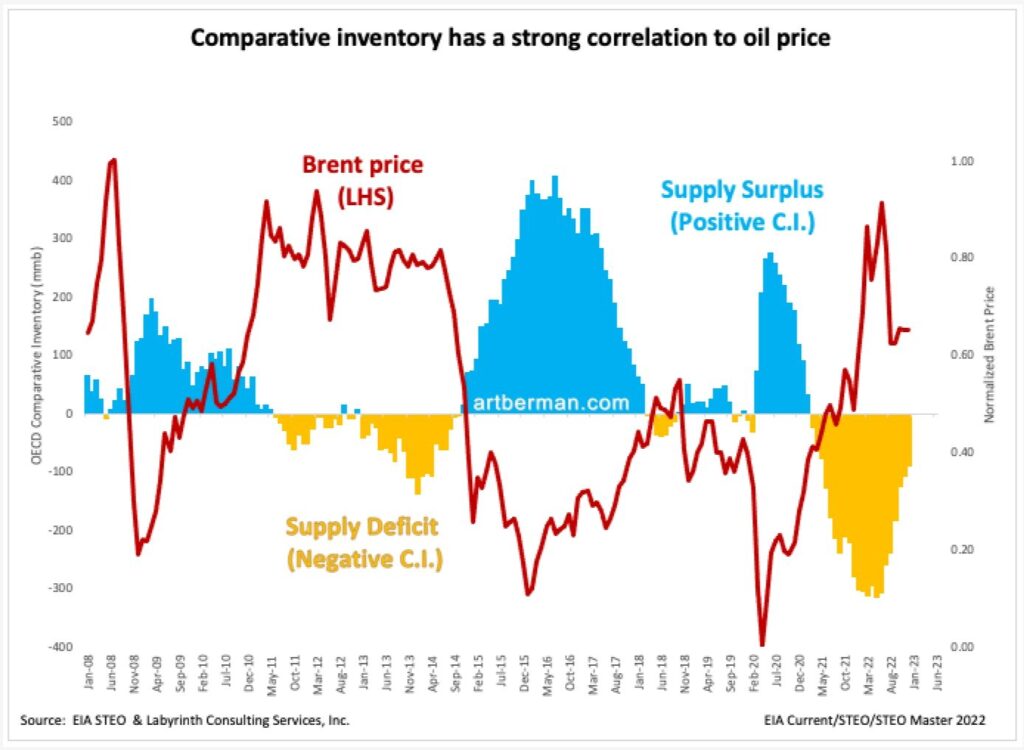
Comparative inventory, on the other hand, accounts for additions to and withdrawals from storage based on supply and demand, as well as the reserve base that represents the storage equivalent of investments and savings. Not surprisingly, it has a strong correlation to oil price (Figure 6).
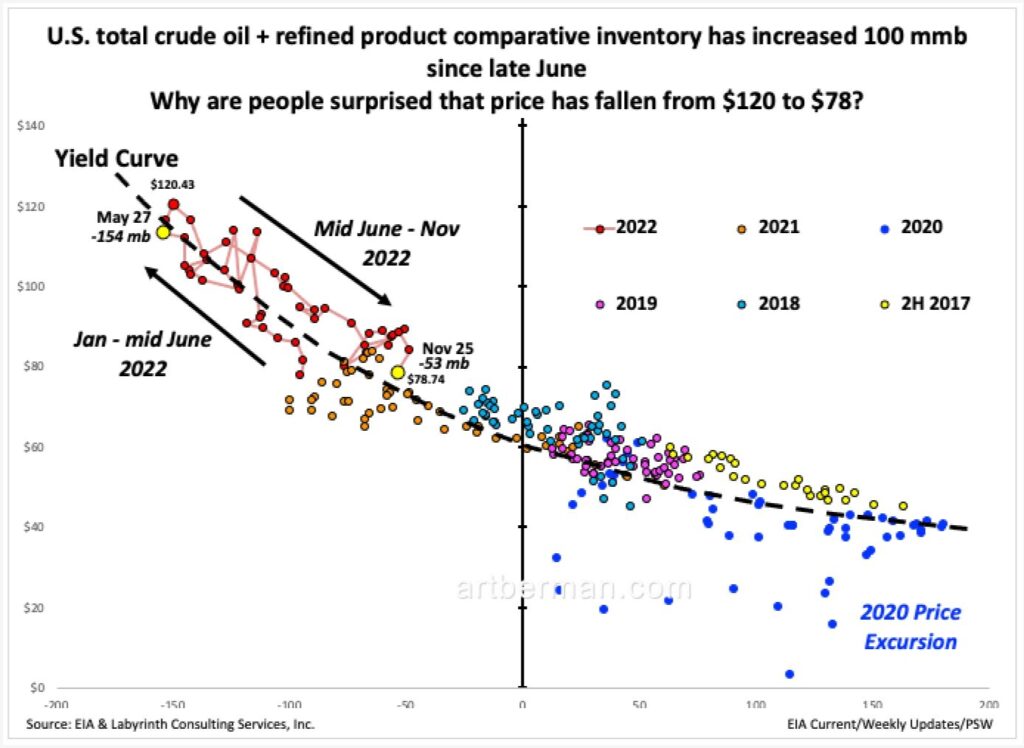
U.S. comparative inventory has increased from -154 mmb less than the 5-year average to -53 mmb less than the 5-year average since late May (Figure 7). Why is anyone surprised that WTI price has fallen from $120 to $78? I suppose only the analysts who talk about tight supply but rarely consider stock change indexed to its 5-year average. Based on the dashed black yield curve, WTI is priced correctly at today’s December 6 futures close of $74.25.
Oil prices will respond to changes in comparative inventory as they always have. If comparative inventory continues to increase, prices will continue to fall.
The way that most analysts use supply and demand is simplistic. It assumes that oil is a system that is ordinarily in equilibrium with occasional periods of dis-equilibrium. The truth is that, like all complex systems, it is never in equilibrium except in the human imagination.
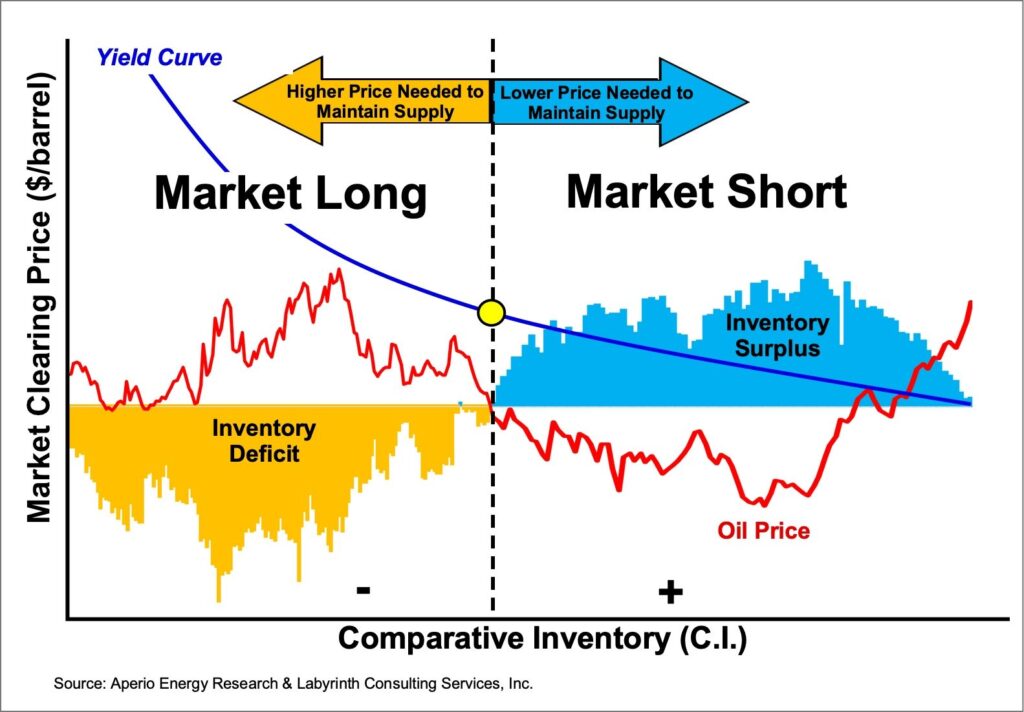
Markets are always long or short based on comparative inventory (C.I.), not the supply-demand balance (Figure 8). When C.I. is in deficit, markets are long and use higher price to encourage producers to drill more wells. When C.I. is in surplus, markets are short and use lower price to discourage drilling.
The price decrease over the last month shows that investors have finally learned what the market has known since June. Supply is not “incredibly tight.” The analyst chorus continued to proclaim that inventories were at record lows when in fact, comparative inventory has been increasing for months.
Whatever comes next, it will not be a straight line toward lower or higher prices. There is a still a C.I. deficit and prices will rise and fall as C.I. rises and falls.
The key take-away is that prices don’t just increase to $100 or $120 because analysts think they should. For prices to rise to $100 in 2023, C.I. must fall by about 75 mmb. That would take about 30 weeks based on the average weekly rate of decrease between October 2021 and June 2022 when C.I. reached a minimum. It might happen somewhat faster or slower because things have changed since the first half of 2022 but first, C.I. has to stop increasing. It is baffling that people believe analysts who publicly make price claims that have no empirical precedent.
My guess is that prices will not fall much farther. Price has adjusted to where it should be based on today’s comparative inventory.
We are witnessing a momentous transformation of the world economy. Covid-19 was the powder and the Ukraine War was the shot but the forces disrupting oil markets and the global economy have been developing for a long time. Chief among those are debt and the energy-blind expectation that fossil fuels can be quickly replaced by renewables. The resulting energy shortfall led to higher prices which are now breaking the economy. Demand destruction is the first step and price deflation will be next.
Energy is the economy and oil is the most important part of energy today. It is not surprising that oil should be the bellwether for the rest of the economy.
Oil prices are not returning to $100 nor is the economy returning to normal.
Like Art's Work?

Share this Post:
Read More Posts
here is bone head question from a rank amateur…With strategic petroleum reserves down and with ( I have read) that the Saudi reserves are down by 50%) but china has massively increased reserves…where does this agregate CI data draw from…I know this should be obvious but not to me…
Great summary and article like always Art!
I am not so sure current “low” prices will rejuvenate the economy – but (much) lower prices at some point for sure. Price is just a function or result of its supply (CI graph). Don’t forget the effect of the FED’s (over)tightening with record speed and its damage. Looking at graph 4 I see supply levelling off as the FED starts tightening at the start of 2022. Is that causation or correlation?
Agree. CI is the best indicator of how much stuff is out there, and that has been going up. If the economy nosedives, we can expect lower or more of the same, not higher prices. These are difficult times. A positive is low oil prices will help rejuvenate the economy.