Art Berman Newsletter: December 2021 (2021-11)

The price collapse over the last four weeks has been extraordinary. WTI has fallen -$17.89 (-21%) since November 9 (Figure 1). Many say that this is because of the concerns about the latest Covid variation but its first report was in the Netherlands on November 19—ten days after markets started shorting oil.
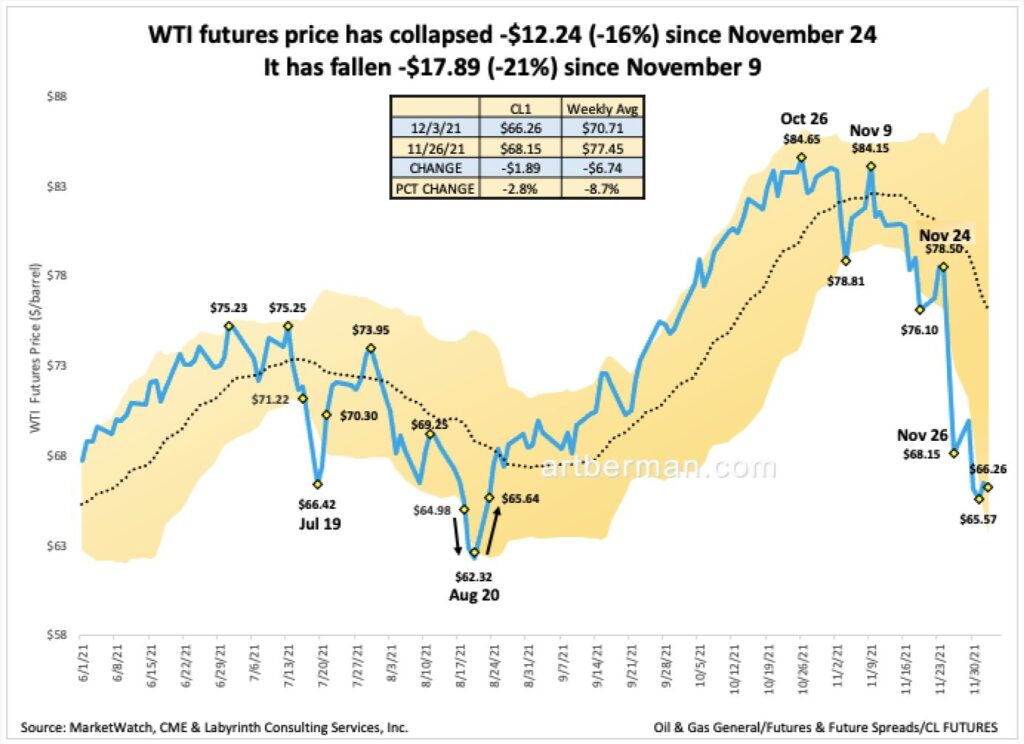
It is useful to compare the market’s response to discovery of the Delta variant in August 2021. WTI fell from -$69.25 on August 12 to $62.32 (-10%) on August 20 and then recovered as rapidly as it had declined.
The price response in November was completely different. The percentage decrease has been more than twice as great and there is little sign of a reversal so far.
Some analysts have said that markets over-reacted but neither price nor 12-month spread is outside the yellow-shaded Bollinger bands in figures 1 and 9. That means that values are within the “normal” range of two standard deviations around the 20-day simple moving average.
A crucial factor in the decline of oil price has been the turn-around of working capacity at Cushing. Cushing working capacity reached a minimum the week ending October 29 and WTI spot price reached a maximum of $83.84 the same week (Figure 2). Price has fallen to $77.79 as capacity has increased.
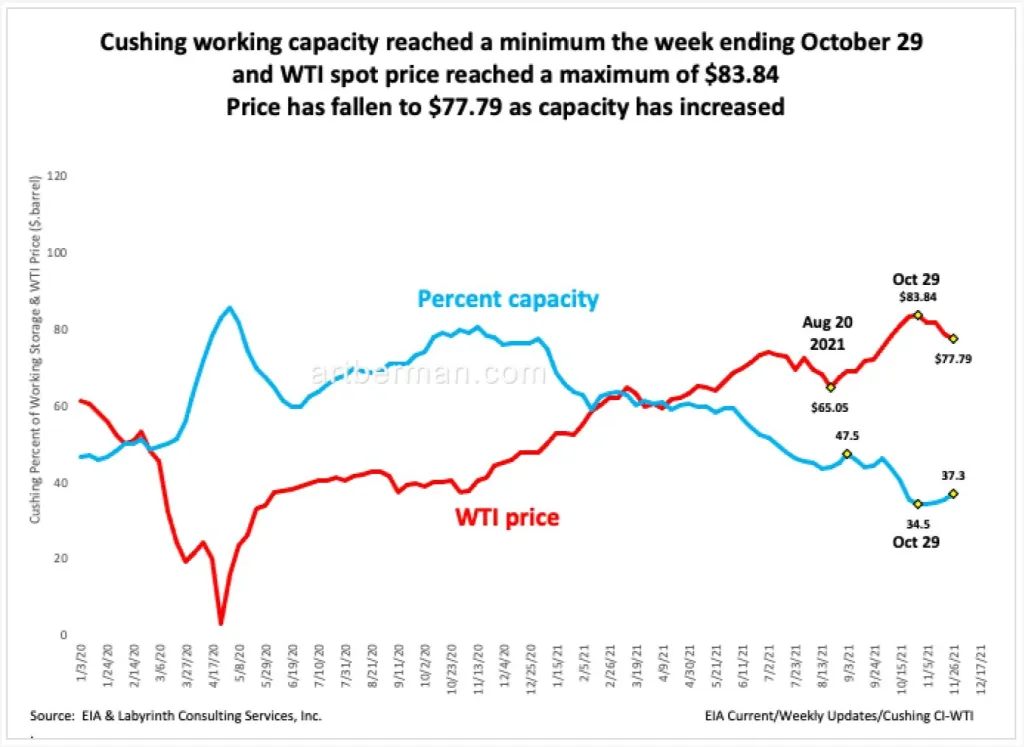
Cushing, Oklahoma is the pricing point for WTI and markets get anxious when working capacity either falls below about 40% or rises above about 80%. Capacity remains less than 40% but it is moving in the right direction and price has responded to this among other factors.
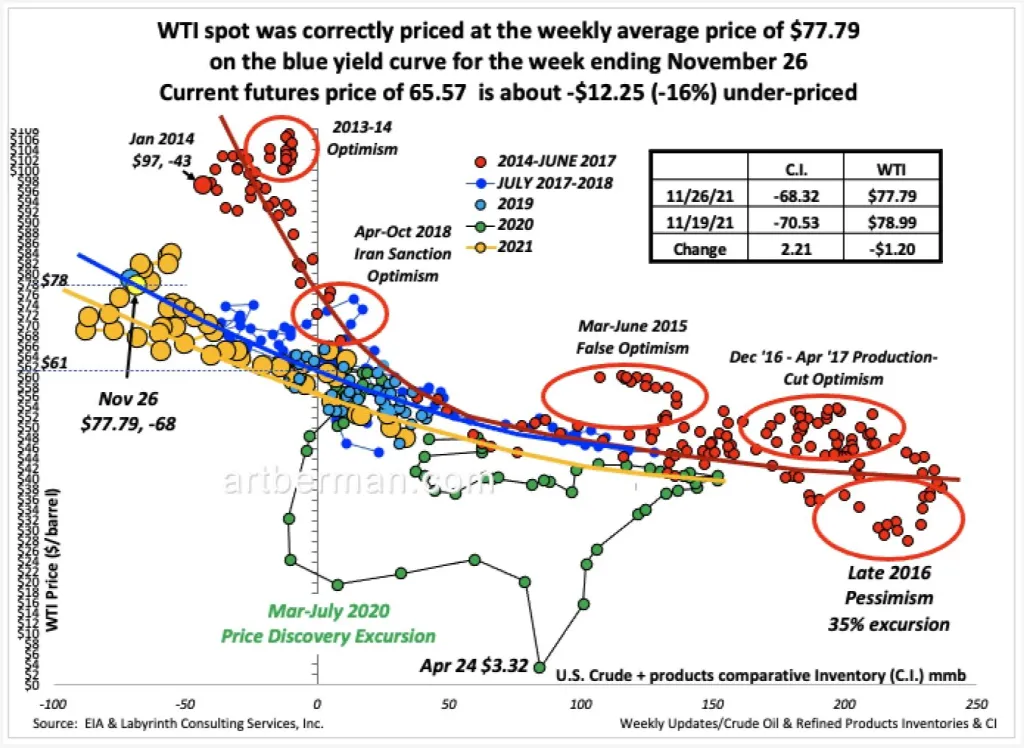
Those who say that markets over-reacted do not understand the mechanics of price formation. Markets consist of people and human behavior does not follow the expectation of analysts. Price excursions—or deviations from the yield curve—represent periods of price discovery. When traders perceive that something has changed, they will bid prices up or down until no one is willing to take the other side of the trade. Then, price-volume data either reverts to the yield curve or moves to a new one if the discovery process reveals a new sense of supply urgency that warrants higher prices.
Figure 3 shows that monthly WTI price-volume data for October (blue circle) and November (yellow circle) were about 5% above the blue yield curve. The present futures price of about $66 is 15% under-priced based on current inventory levels.
The red ovals in Figure 3 indicate significant price excursions over the last 7 years. These commonly reflect deviations of 15-30% above or below the yield curve. By that measure, a 15% deviation is notable but not extraordinary.
Markets are signaling producers to back off a bit on drilling because supply urgency has decreased for now. Omicron is a factor but price, spreads and Cushing capacity began changing before the new variant was discovered. Markets know that key forecasting groups expect a supply surplus in early 2022.
Still, bullish analysts interpret the November price collapse as a bump in the road.
Goehring and Rozencwajg (G&R) wrote a week ago that, “We continue to expect the oil crisis will take place as we progress through 2022…Non-OPEC production growth has disappointed while strong demand continues to surprise…Demand will exceed pumping capacity by the end of next year.
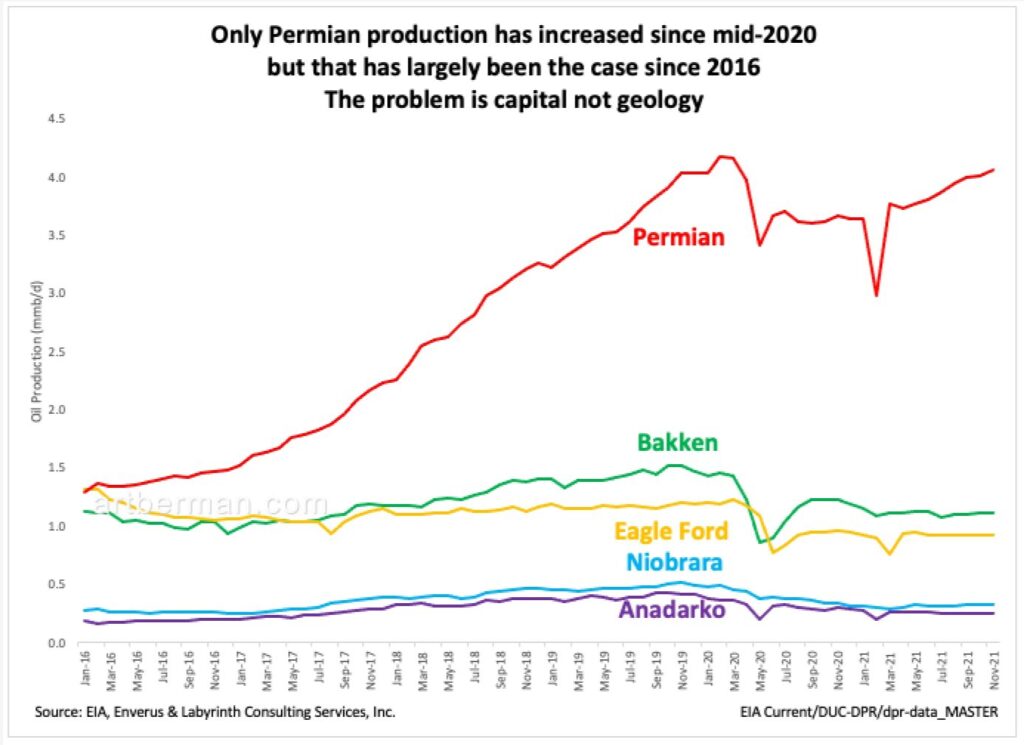
They went on to say that, “It is no surprise the US is not seeing a strong rebound in production: the shales are suffering from depletion, a topic we first discussed in late 2019. Every shale basin except the Permian is experiencing outright decline.”
It is true that only Permian production is growing but where have G&R been for the last five years? Permian growth has dominated U.S. shale production growth since 2016 (Figure 4). Nor does falling production necessarily mean depletion. The problem with shale growth is depletion of credit, not reservoir.
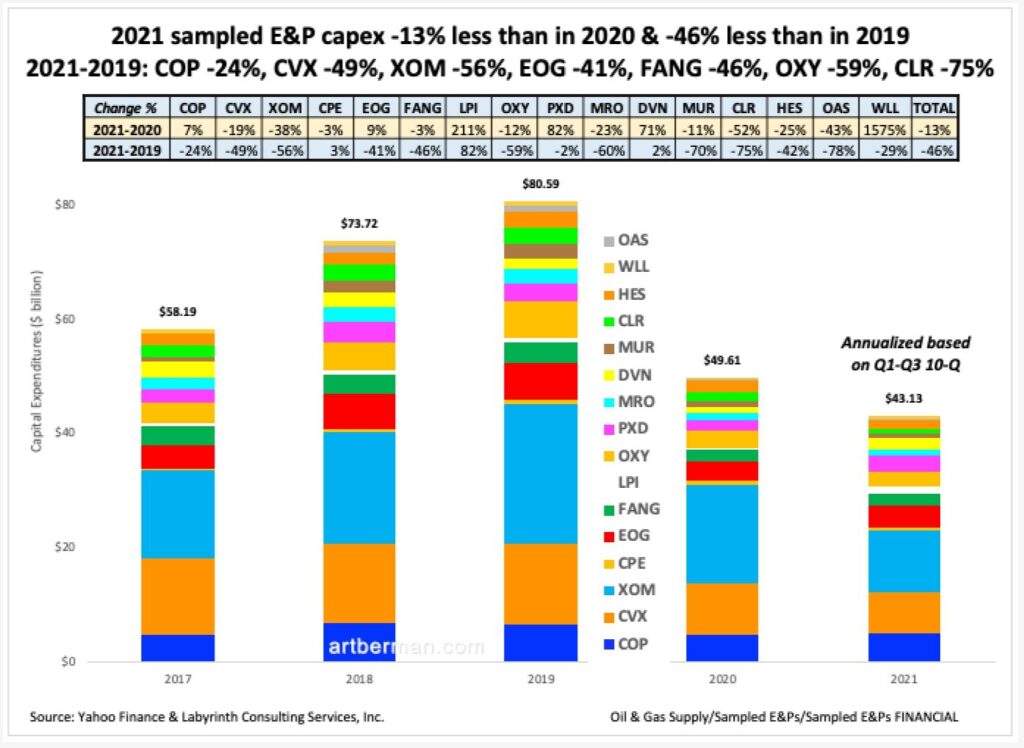
Capital expenditures for tight oil-focused E&P companies are -13% lower than in 2020 & -46% lower than in 2019 based on three quarters of reported data for 2021 (Figure 5). That is partly because credit markets have been less available to oil companies since about mid-2018.
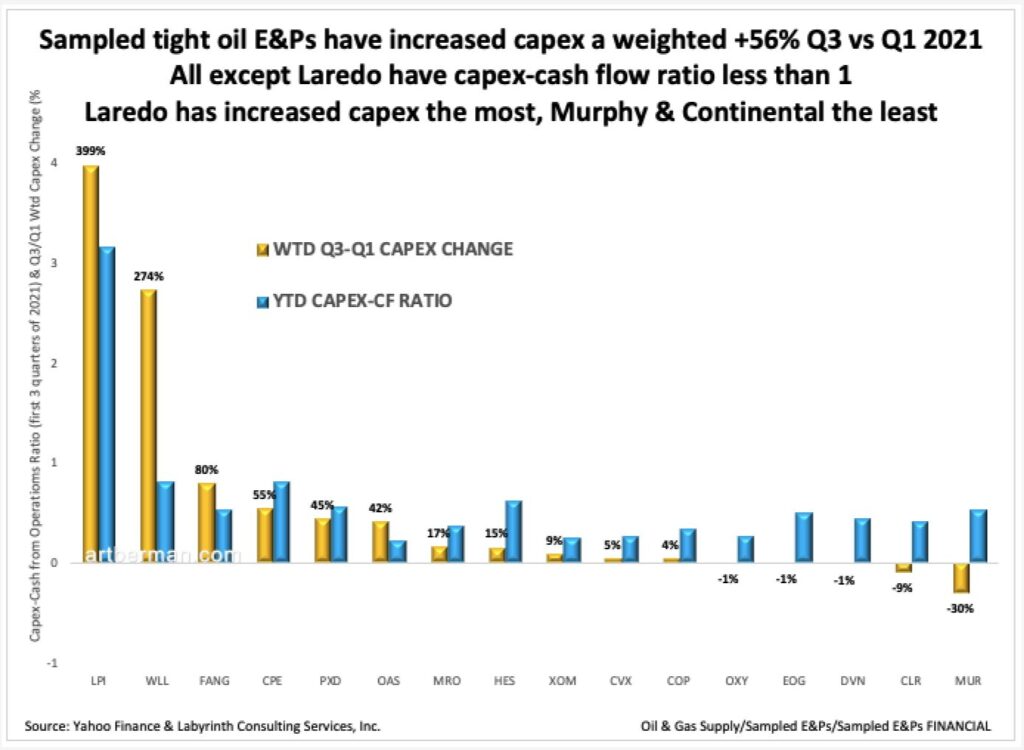
It is also because investors demanded that these companies demonstrate financial returns before bringing capital to them. Figure 6 show that the companies are doing that.
All of the 16 sampled shale-focused E&P companies that I follow had capital expenditure-to-cash flow ratios less than 1.0 in the third quarter of 2021 except Laredo Petroleum which increased the percent of capex the most among its peers.
The chart further shows that weighted capex has increased 53% compared with the first quarter of this year.
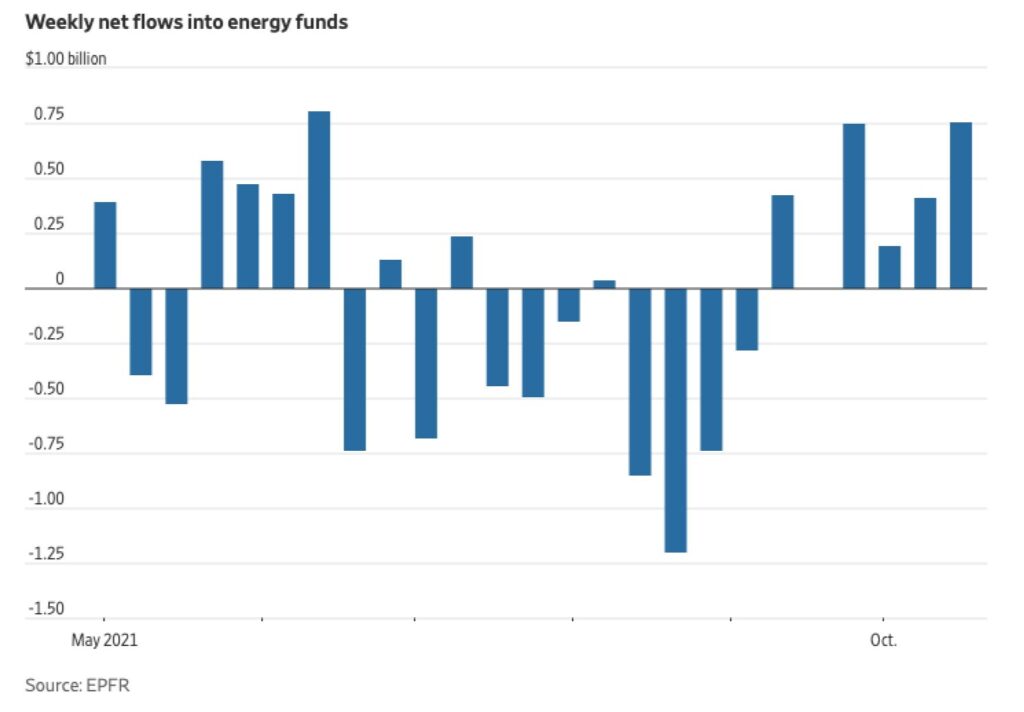
In last month’s newsletter, I focused on the critical role of inflation as an indicator of future oil price and demand growth. It is no surprise that investors are hedging their inflation concerns in part by putting capital into energy-focused funds. Figure 7 shows that these funds have had four straight weeks of inflows for the first time since the spring, with the last week in October totaling $753 million—the highest weekly total in five months.
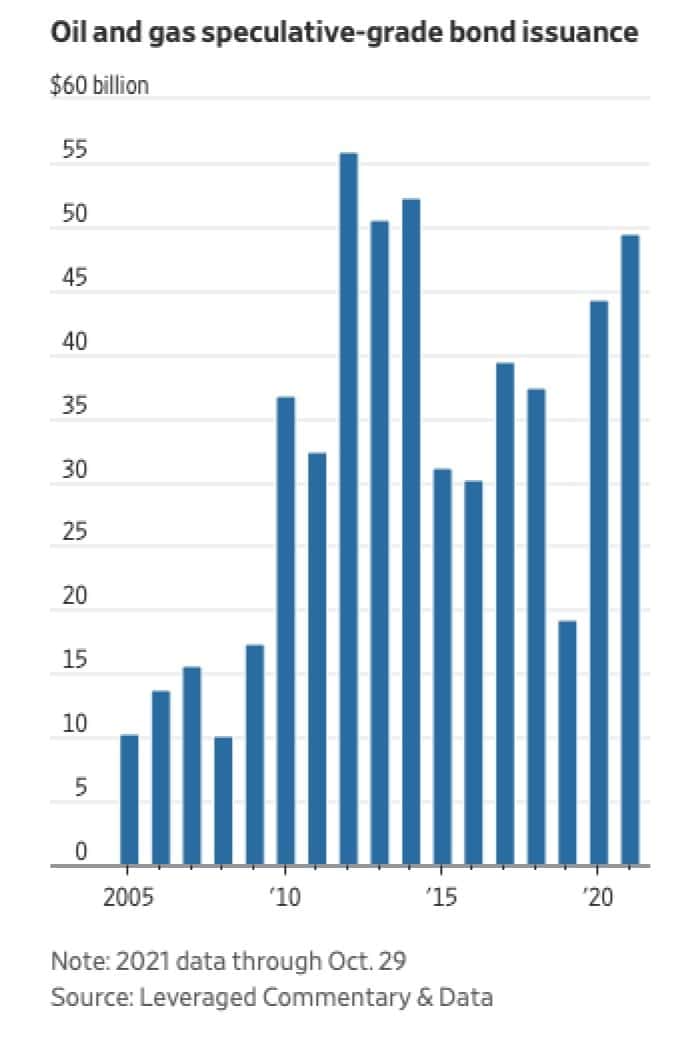
Through October, energy companies have issued $49.5 billion in speculative-grade bonds, almost as much as for the full-year record of $55.9 billion set in 2012 (Figure 8).
Analysts who beat the drum about under-investment and say like Goldman’s Jeff Currie that “there’s no supply increase in sight“, either aren’t paying attention or are too busy pitching their own bullish book to care.
What about oil supply and demand?
Most analysts expect a return to pre-pandemic demand levels by the end of next year. They may be right but that will still be about 3 mmb/d below the growth trend line from before 2020 using the OPEC-EIA forecast (Figure 9). Moreover, larger supply-demand imbalances in 2021 than those forecasted for 2022 did not result in Brent prices higher than $78 per barrel.
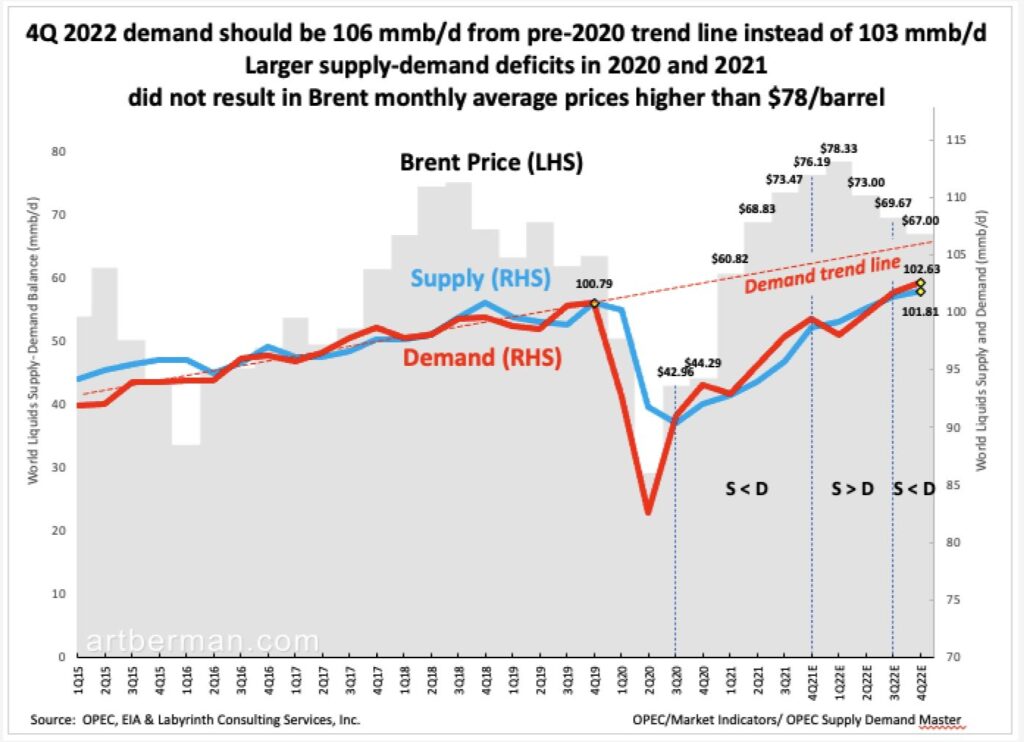
For example, supply was less than demand from the fourth quarter of 2020 through the end of 2021 but prices were less than $77 per barrel. The S-D deficit in the third quarter of 2021 was -2.2 mmb/d . That was the greatest deficit since the first quarter of 1989 and yet price was only $76.19. That is real, not a forecast.
The largest S-D deficit after this quarter is expected to be only -0.8 mmb/d in Q4 2021 and again in Q4 2022. The forecast is for a +1.2 mmb/d surplus in the first quarter and +0.5 mmb/d surplus in the second quarter, followed by a deficit of -0.37 mmb/d in Q3 and -0.82 mmb/d in Q4.
Where are huge supply deficits that analysts talk about? The are right now and prices are hardly on the verge of $100 per barrel. I would be much more concerned about supply surpluses than supply deficits for 2022.
Standard Charter’s Paul Horsnell recently commented that the recent price collapse “deflation of a bubble created by overstatements of market tightness…The market needed the expectation of something large enough to stop any push on to $100/b, stop the super-cycle talk and to start to price in some already fairly weak Q1 balances.”
When the popular narrative is challenged with data, we find it is more of an opinion than a rigorous analysis. The important yet simple take-away is that markets are not nearly as suggestible as most analysts and investors.
Like Art's Work?

Share this Post:
Read More Posts
What lending entity would lend to a Shale producer?
What is a realistic price for crude in order to re-start Shale production?
Happy Holidays
Doug Edwards