Art Berman Newsletter: February 2022 (2022-1)

In October 2021, Saudi oil minister Abdulaziz bin Salman bragged about how masterfully OPEC+ had managed oil markets. Now he’s lost control
Yesterday, J.P Morgan said that oil prices could easily increase to $120 per barrel.
WTI closed at $91.32 and Brent at $92.69 on Monday, February 7. Prices are lower today (Wednesday, February 8) as markets consider lessening tensions in Ukraine and expectations that Iran may resume crude exports this year. Still, Brent has recovered to more than $91 per barrel.
Analysts have said that oil prices are going to $100 per barrel during most of the price rallies since early 2018. They were wrong. Now, they are saying it again. Are things really different now?
They are.
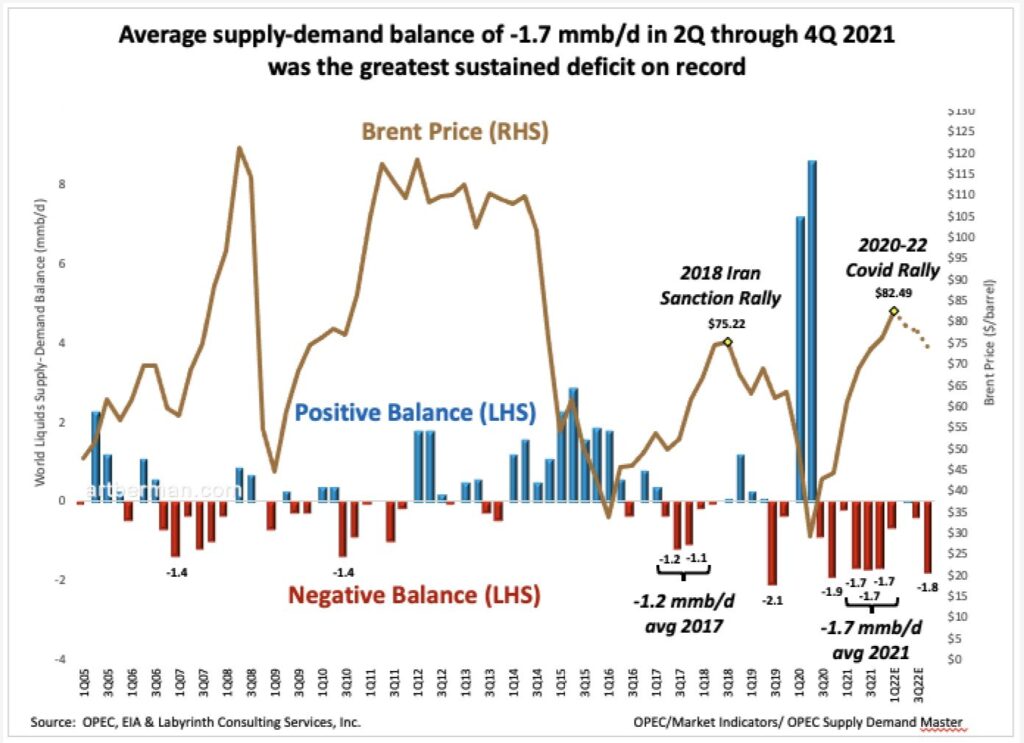
The history of “oil is going to $100” has not ended well since oil actually was $100 in 2014 (Figure 1). Oil was “going to $100” in 2018 during the Iran Sanctions Rally but prices collapsed and fell from $75 in early October to $44 by late December. In July and October 2021, many analysts declared that oil is going to $100. In July, price fell from $73.95 to $65.07 and in October, it dropped from $83.49 to $66.89.

Now in early 2022, the consensus seems to be that price will increase to at least to $100. WTI averaged almost $90 per barrel for the week ending February 4 and I have little doubt that it will move higher in the near-term. But will this broader rally collapse like every other since mid-2014?
Probably not.
The global supply-demand deficit for the second through fourth quarters of 2021 was more than -1.7 mmb/d (Figure 2). That’s the greatest extended deficit on record.
The last realistic run at $100 oil was in 2018 during the Iran Sanction Rally. The world supply-demand balance turned negative in the second quarter of 2017 and reached a -1.2 mmb/d deficit in the last two quarters of 2017. Despite a decreasing supply deficit, prices continued to increase as U.S. tensions with Iran rose. Markets are all about ensuring there is sufficient supply in the medium- to long term. They will keep prices high sometimes despite fundamentals until supply is more secure.
In April 2018, the U.S. announced it would pull out of the Iran Nuclear Pact in April 2018 and reinstate sanctions on Iran’s oil exports in October. OPEC+, the U.S. and all other countries that could went into maximum production mode. Then, U.S. president Donald Trump announced sanction exemptions for several countries and prices collapsed in late 2018 to $44 per barrel.
In 2018, OPEC had plenty of spare capacity and U.S. tight oil production was booming. Today, only Saudi Arabia and the UAE have sufficient spare capacity to make a difference and it is not likely that they are willing to act alone. Countries like Angola and Nigeria are unable to increase output because of under-investment in maintenance during the Covid period of 2020 and 2021. Some analysts even question whether Russia has sufficient capacity to boost production.
Output from U.S. shale plays is increasing but remains almost 900,000 barrels per day less than late 2019 pre-Covid levels. As I noted in last month’s newsletter, there are about 23 billion barrels of proved reserves in the plays but companies seem committed to limited growth. They are desperate to win back investors who lost money during the boom times that followed the 2014 oil-price collapse.
ConocoPhillips CEO Ryan Lance said last week, “If we are getting back to the level of growth in the U.S.” comparable to the 2014-2015 shale boom & “you’re not worried about it, you should be.”
Tight oil production has increased about 60,000 barrels per day each month since June and is about 7.5% higher now than seven months ago. Citi’s Ed Morse said, 2022 ” is going to be a very big surprise…The growth in U.S.production…is going to be bigger than anything…from an individual OPEC country…If we look forward to a year from now…is [OPEC] going to be restraining production again to fight what might otherwise be a $20 lower price?
He may be right but I doubt it will amount to enough to make much difference before the end of the year.
A new nuclear agreement with Iran seems more likely and that might add 1 mmb/d to supply but not much before year-end. OPEC+ output may increase by 900 kb/d in May if member countries decide to and are able to honor commitments made in 2021.
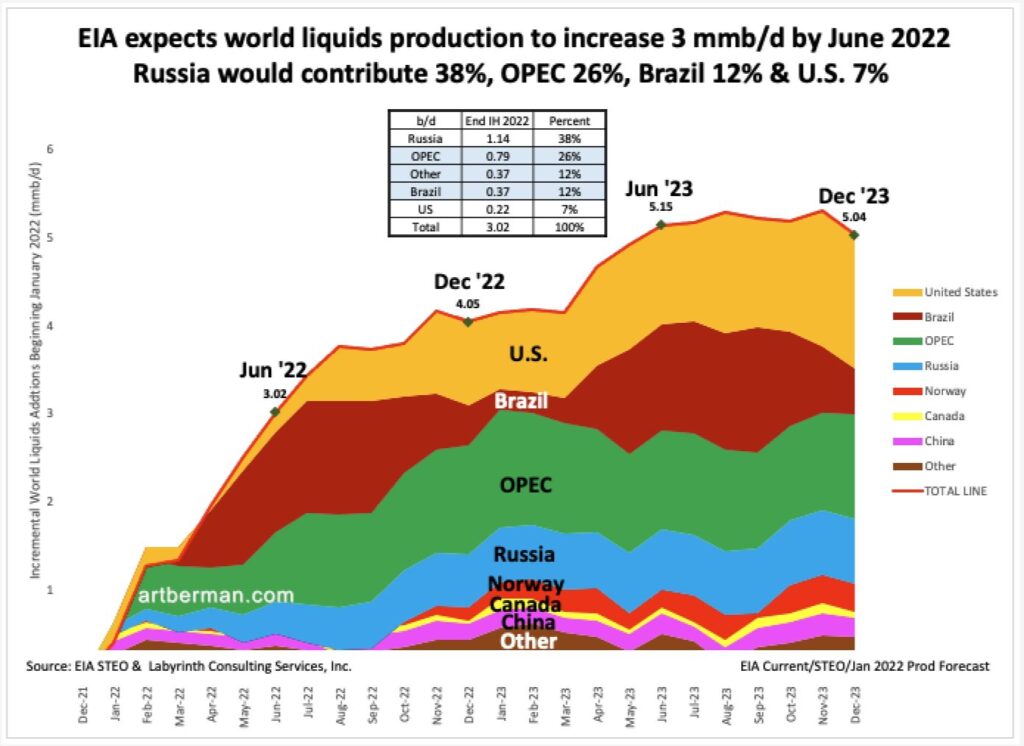
EIA’s Short-Term Energy Outlook published yesterday is more optimistic. It expects world liquids production to increase by 3 mmb/d by June 2022 (Figure 3). Russia would contribute 38%, OPEC 26%, Brazil 12% & the U.S. 7%.
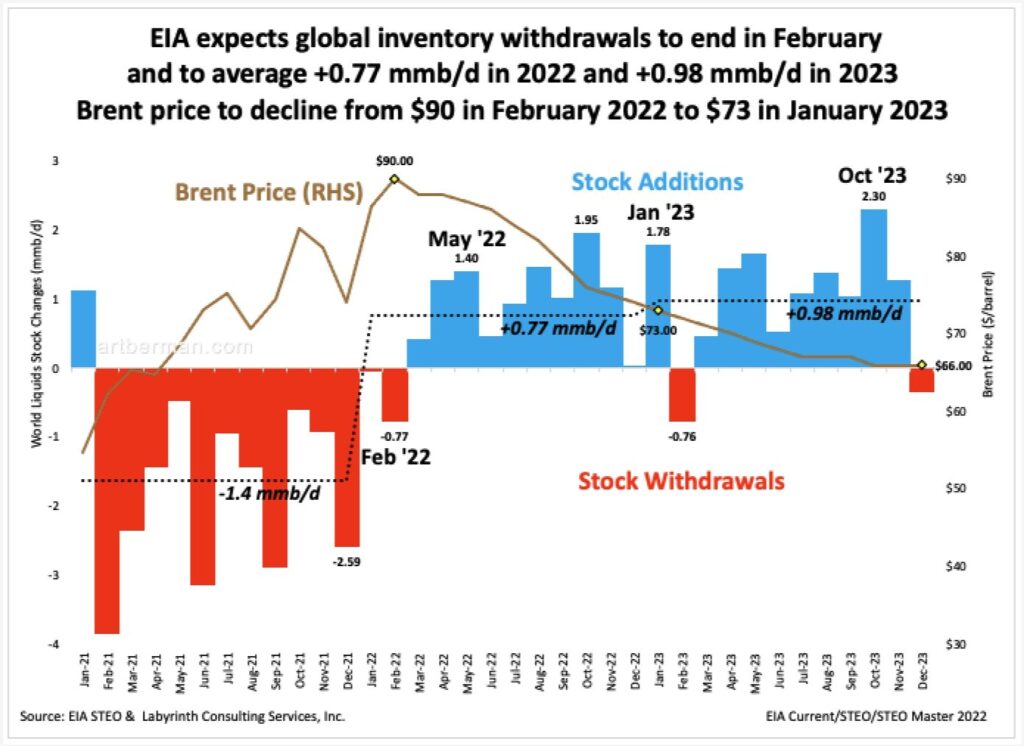
EIA, furthermore, expects global inventory withdrawals to reverse after February (Figure 4). Withdrawals averaged -1.4 mmb/d in 2021 but EIA forecasts +0.77 mmb/d average additions in 2022 and +0.98 mmb/d additions in 2023. The agency expects Brent spot price to peak at a monthly average price of $90 in February and to decline to $73 by December.
EIA’s projections are plausible but seem too aggressive.
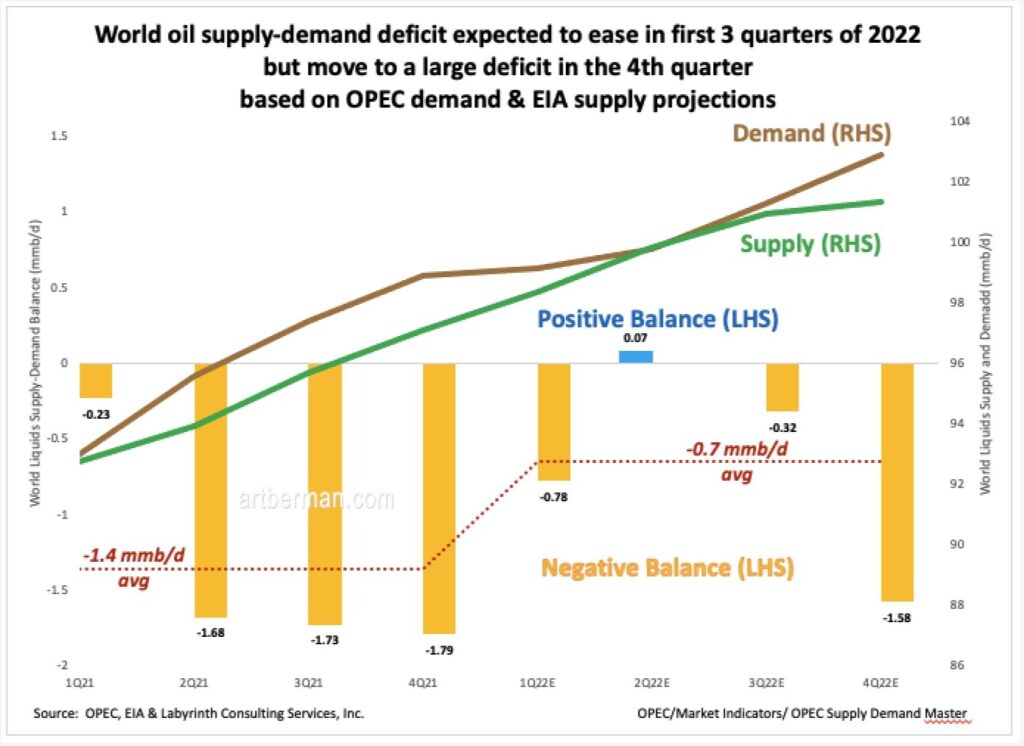
Combining a somewhat discounted EIA supply forecast with OPEC’s demand projections, we arrive at a more realistic—if still uncertain—view of the future. Figure 5 shows that supply and demand will approach balance in the first half of 2022 but return to a considerable deficit by the end of the year. The average 2022 deficit will be only half as great in 2021 but the fourth quarter deficit of -1.58 mmb/d will be a considerable increase.
These forecasts will be wrong in many ways, and will be modified every month along the way. They are useful, however, because they provide a notional idea of future outcomes based on current assumptions. They also are based on business-as-usual economic activity.
Inflation is the wild card.
January U.S. inflation increased from 8.25% to 8.75% while WTI spot price rose to $83.22 (Figure 6). Inflation is complex but higher oil and energy price is among the leading—if not the leading—reasons for higher inflation. As I explained in last month’s newsletter, the factors controlling oil demand destruction are also complex but there is an empirical correlation between inflation rate and oil demand destruction.
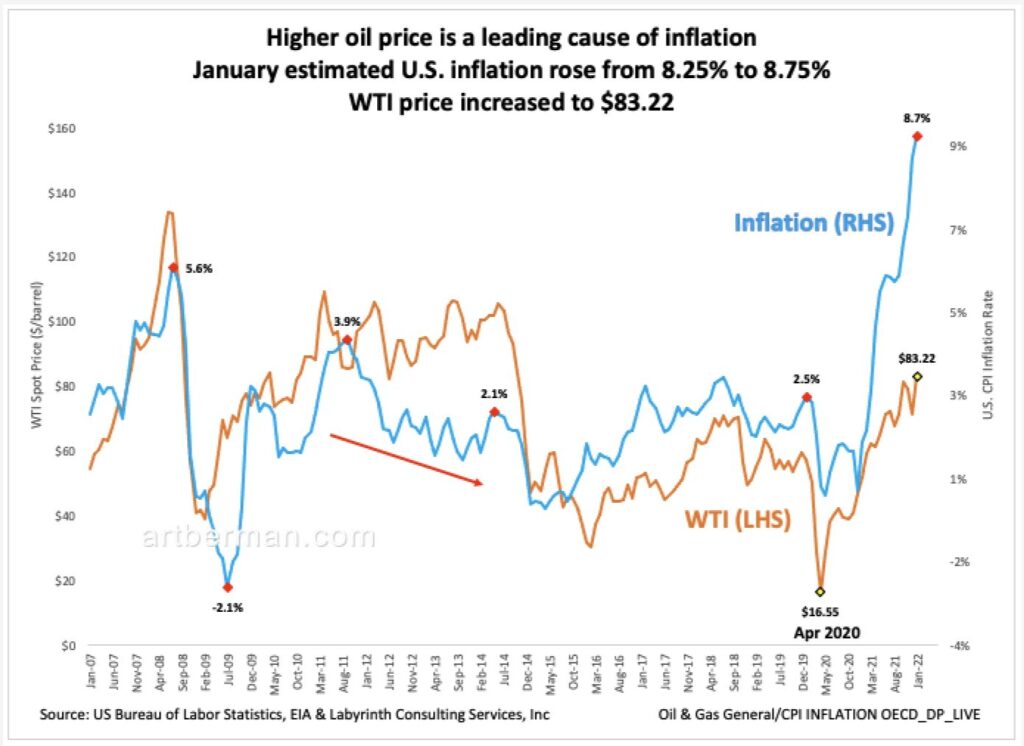
High oil prices and inflation rates are already affecting economic activity and will eventually reduce demand for oil. January inflation data will be released later this week. Jack Ablin, Cresset Capital Management CEO, said Monday, “We could potentially get a very difficult number to digest next week on the inflation front and that has the potential to cut the markets off at the knees.”
Comparative inventory (C.I.) is probably the best way to understand oil-price formation. C.I. and WTI spot price have a strong inverse correlation. When C.I. greater than the 5-year average, there is generally a supply surplus and when it is less than the 5-year average, there is generally a supply deficit.
C.I. moved from more to less than the 5-year average in April 2021. Figure 2 above shows that world supply and demand moved from near balance in Q1 of 2021 to a -1.7 mmb/d deficit in Q2 of 2021.
Today, C.I. is within 8 mmb of its record low set in March 1996 (Figure 7). It is at similar levels to those in the early 2000s that drove prices from $11 in 1998 to $143 in 2008. The current C.I./supply deficit is more than twice as great as it was in 2018.
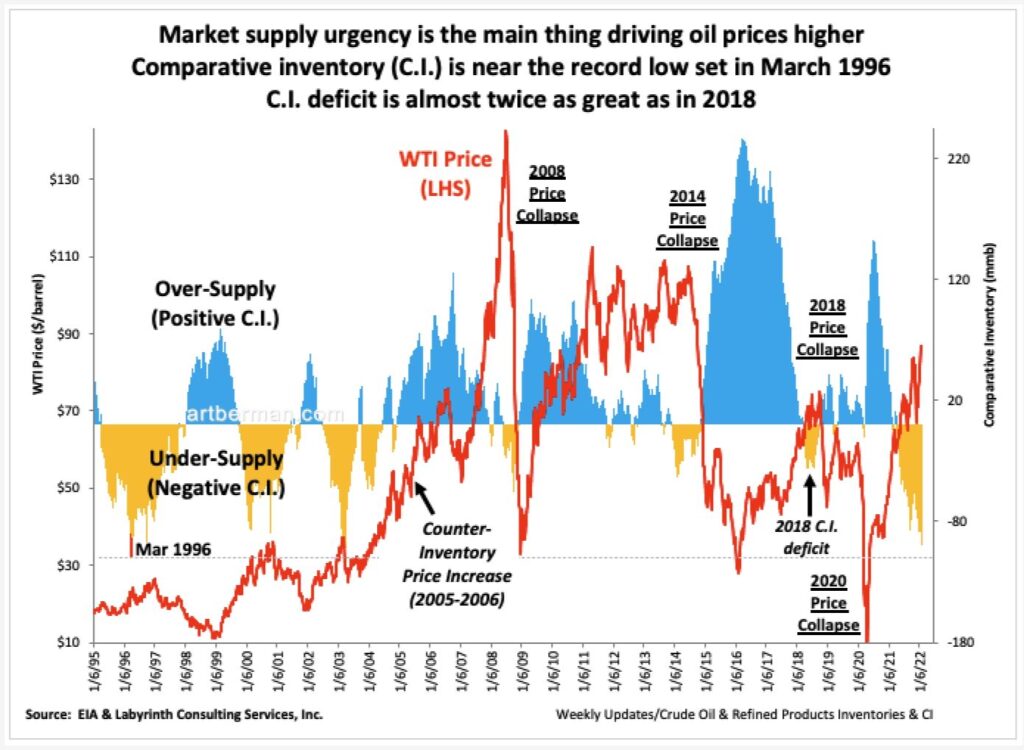
The only time in history that C.I. and oil price did not consistently correlate inversely was in 2005 and 2006 (shown by the arrow and text “Counter-Inventory Price Increase” in Figure 7). That happened because of an extraordinary sense of supply urgency by markets as China’s consumption of oil exploded.
I showed in Figure 2 in last month’s newsletter than supply had been flat since 2005. Markets raised price because it was unclear where additional supply would come from. That situation persisted even after supply growth was established by tight oil because markets were uncertain if the new supply would last.
A similarly based supply urgency is driving oil prices higher today. In July, Goldman Sachs’ Jeff Currie remarked, “There’s no supply increase in sight.”
Yet, the Saudi oil minister bragged about how brilliantly OPEC+ had managed oil markets.
“Gas markets, coal markets, other sources of energy need a regulator. This situation is telling us that people need to copy and paste what OPEC+ has done and what it has achieved.”
Abdulaziz bin Salman, Saudi oil minister
“Managed markets have a limited life expectancy. Oil markets have now been managed for almost 3.5 years and they are showing the signs of wear.”
It’s been 21 months since I wrote that and it is as clear now as it was then in June 2020 that oil markets cannot be managed. They can sometimes be helped by short-term cuts or additions but trying to manage the world’s largest commodity market is sheer hubris. Bin Salman’s dangerous error remains waiting for higher demand before increasing supply. The lag is simply too long especially because of the economic damage two years of Covid has done to the world economy.
Bin Salman’s strategy was a recipe for losing control.
This week, Currie said, “Right now, the upside risk in this market is exceptionally high…The markets are incredibly tight from a physical perspective…reflected in that super-backwardation. What it means is that this market is incredibly vulnerable to any supply or demand disruption…The question is, Can you come up with any supply or reduction in demand as you move into the Spring to be able to ease the situation.”
Many oil-market observers discount Goldman Sachs’ calls because they have sometimes been very wrong in the past. I think that skeptics should pay attention to what Currie is saying today.
Like Art's Work?

Share this Post:
Read More Posts