Oil Shock

The chain of events set in motion by the Russian invasion of Ukraine will almost certainly change the structure of energy markets for years to come.
“Everything changed…last week…There’s no going back from this. Whatever lies ahead will be profoundly different from what any of us know. Illusions have been shattered, assumptions exposed, paradigms exploded.”
John Mauldin
Energy prices were high before the invasion. They are higher now and will move still higher as the consequences of this war unfold.
Brent price averaged $93.75 for the first three weeks of February before the war began. It has averaged $110.50 since. The extraordinary price and spread signals to producers reflect the market’s extreme sense of supply urgency.
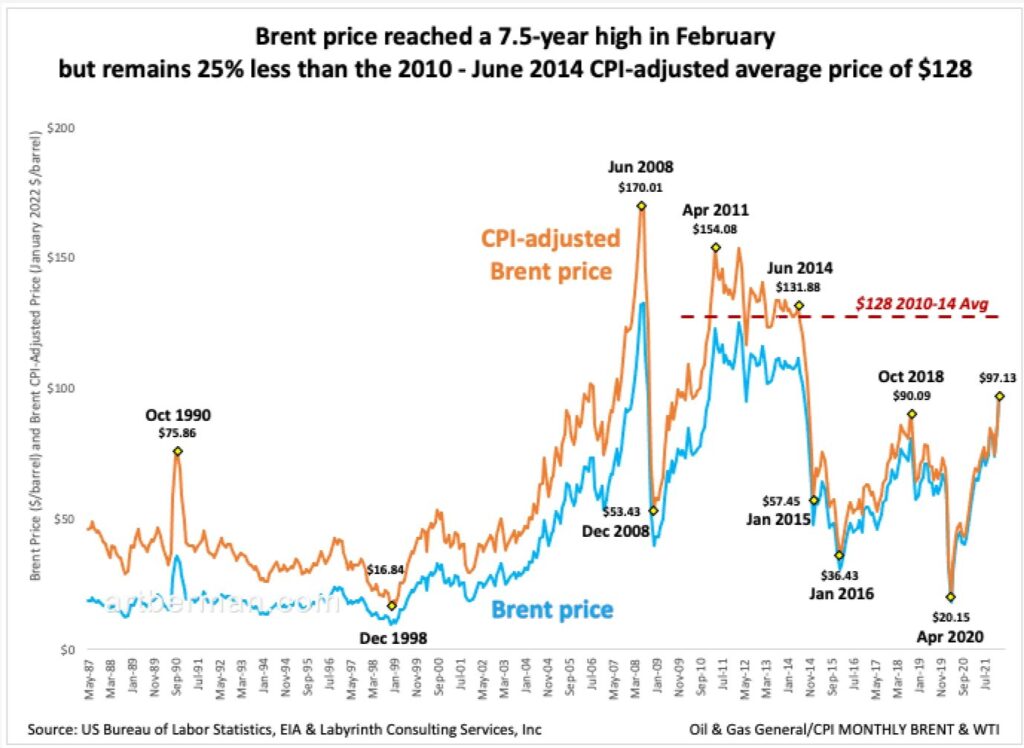
Prices reached a seven-and-a-half high in February but are lower in real dollars than during the last price boom. The February average price of Brent was $97.13. That was almost 25% less than the CPI-adjusted average of $127.59 from 2010 through mid-2014 (Figure 1).
That means that there is plenty of room for prices to increase—if the past is any guide to the future. The only realistic barrier to price growth is demand destruction and economic recession. Both are possible at current prices and probable at even higher prices.
Daily Brent futures price has increased $22 to $120 since the Ukraine invasion began. WTI has risen $24 to $116. The Brent 12-month spread has increased 54% and WTI, 90%. These indicate that markets expect little oil from Russia for some time.
Russia produced 10.6 mmb/d of crude oil and condensate in January—only the U.S. produced more at 11.6 mmb/d. Europe gets about 25% (2.5 mmb/d) of its oil from Russia and most Russian crude trade is currently frozen because of sanctions, freight interruptions and wider political risks.
Ural crude is being deeply discounted but sellers can find few buyers. The market capitalization of the four Russian oil and gas majors has fallen 95% since the Ukraine attack began.
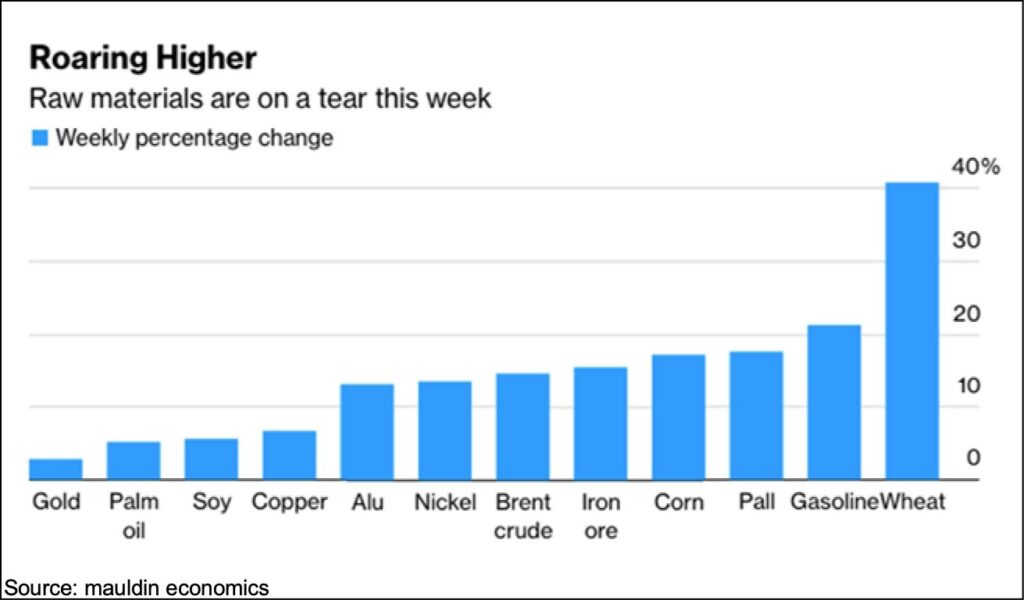
With all of that in mind—not to mention the risk of nuclear war—the higher price of oil is hardly surprising. Yet, what is happening in Ukraine goes well beyond oil. There were already raw material shortages in much of the world. Sharply higher futures prices indicate that those may now accelerate.
Ukraine and Russia provide approximately 25% of the world’s wheat supply, and Russia and Belarus are the world’s second and third largest suppliers of potash and nitrogen for fertilizer. Russia and Ukraine provide about 70% of the world supply of neon and xenon that are important for semi-conductor manufacture. The price of wheat increased 40% last week alone and gasoline rose more than 20% (Figure 2).
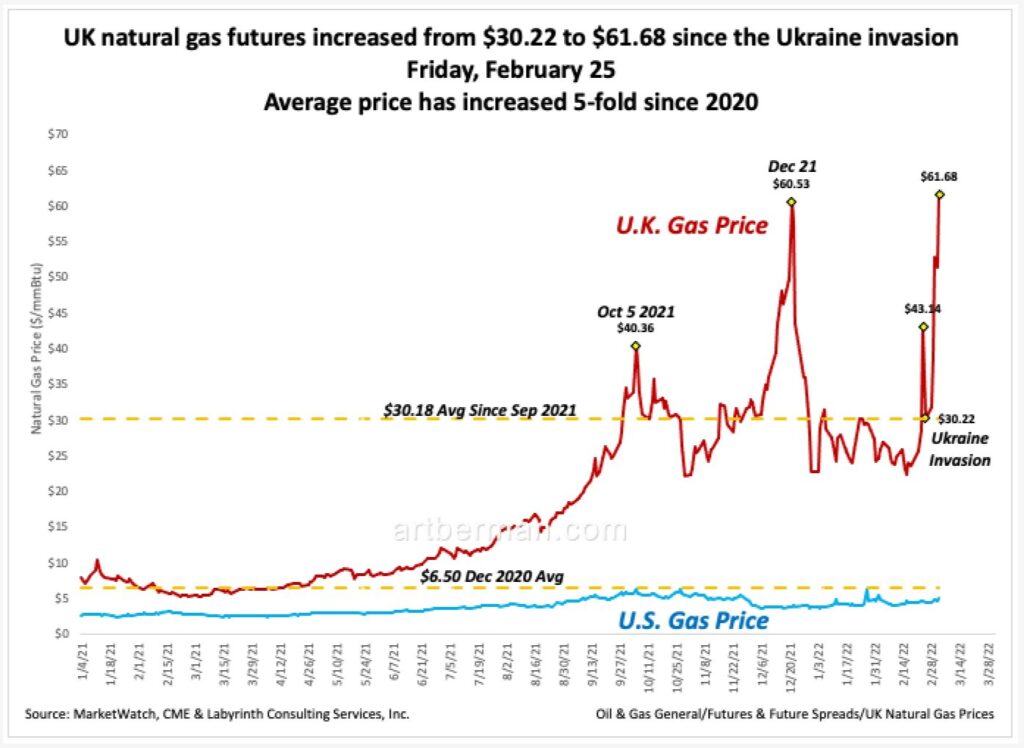
Natural gas futures price in the United Kingdom has increased from $30.22 to $61.68 since the Ukraine invasion (Figure 3). The average price had already increased 5-fold since December 2020 before recent events in Ukraine because of the pandemic, supply-chain interruptions and naive reliance on “renewable” energy sources.
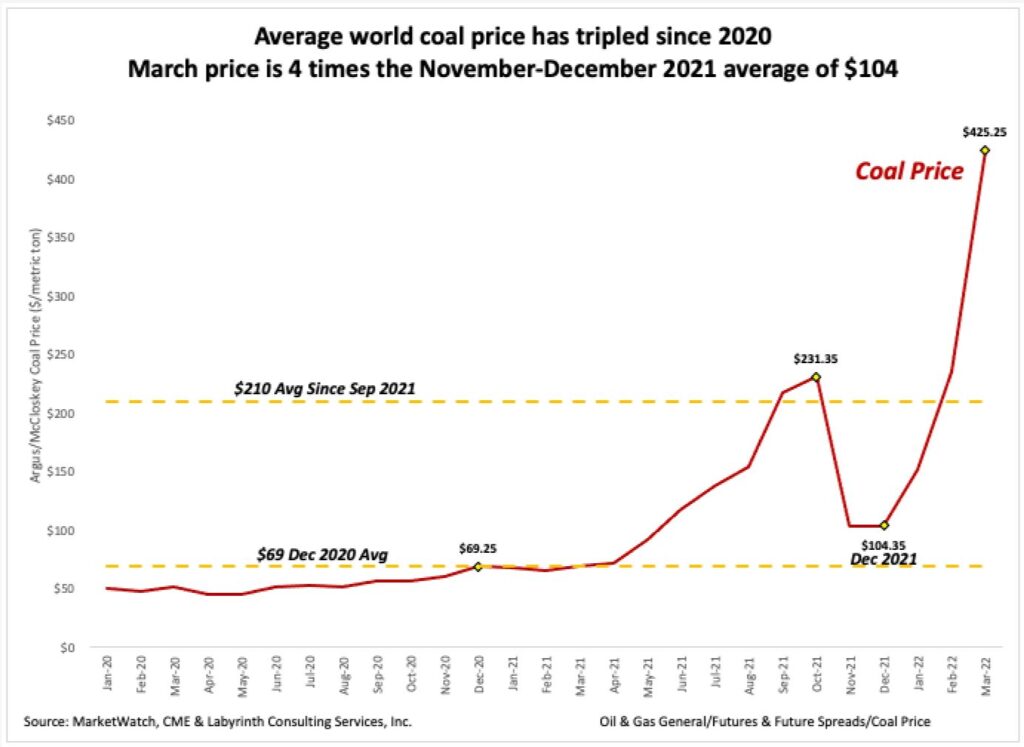
World coal futures price is four times higher now than the November-December average of $104 (Figure 4).
Energy is the economy and inflation rates reflect the rising cost of oil, natural gas, coal—and even so-called renewable energy. Economists routinely ignore or minimize the relationship between natural resource price and availability, and inflation. The factors that economists emphasize—money supply, interest rates, production and capital flows, and wages—are important but energy prices affect the cost of doing business for everyone.
The correlation between oil price and U.S. inflation rates in Figure 5 is hard to dismiss. February estimated U.S. inflation rose from 7.5% to 7.9% and average WTI price increased from $83.22 to $91.64.

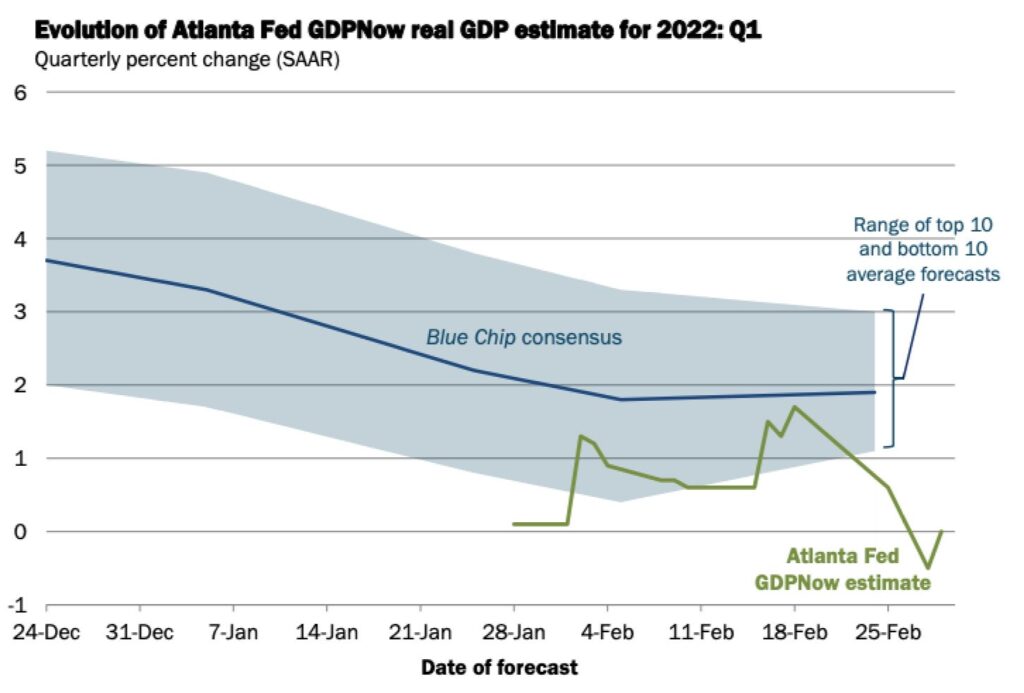
The outlook for U.S. economic growth is darkening. The Atlanta Federal Reserve Bank now estimates zero GDP growth for the first quarter of 2022 (Figure 6). This is almost 2% less than the average of consensus forecasts. I will leave the analysis of this information to others but I see a clear relationship between higher energy prices, higher inflation rates and lower economic activity.
It is difficult to imagine a scenario in which oil and energy prices decrease in the near term.
Figure 7 shows world oil supply-demand (S-D) balance and Brent price since 2005. It also shows and the OPEC demand and EIA supply forecast for 2022. The -1.7 mmb/d average S-D balance during the last three quarters of 2021 was the greatest sustained deficit since world data has been publicly available.
That was before events in Ukraine. The 2022 forecast suggests that a serious supply deficit is likely later in 2022 despite supply increases of about 3 mmb/d in the first part of the year. Almost 40% of that increase was expected to come from Russia and that is almost certain not to happen.
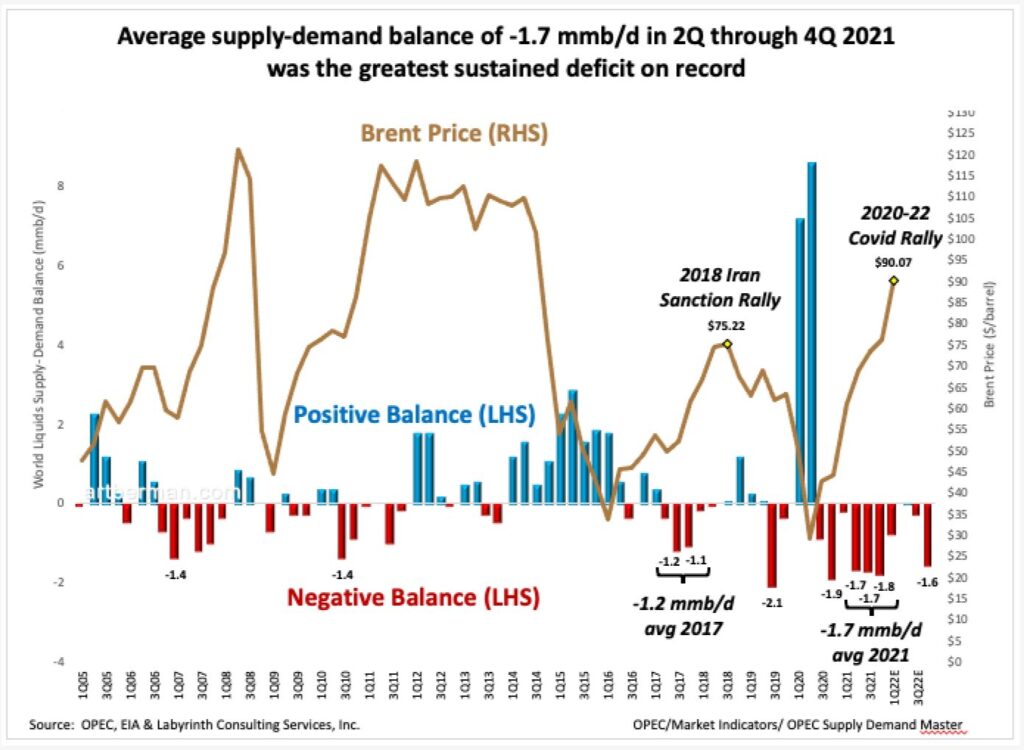
Goldman Sachs’ Damien Courvalin recently offered an accounting of potential supply sources for 2022. Saudi Arabia and the UAE are capable of adding approximately 1.5 mmb/d. Iran may add another 0.5 mmb/d if a nuclear agreement with the U.S. can be reached. U.S. tight oil might add 0.5 mmb/d. He summarized as follows: “”If you bring [all the spare] supply online, you have nothing left. It is still bullish even if you can find the supply to meet consumption needs.”
Recent events in Ukraine introduce tremendous uncertainty into energy markets and the world order that may emerge. For those who think that this war will end and things will go more-or-less back to normal, think again.
I don’t think it is an exaggeration to say that the geopolitical consequences are likely to be the most serious in decades. Whatever the military outcome, the extraordinary financial sanctions imposed on Russia—including freezing its central bank’s foreign assets—will potentially ruin or greatly weaken Russia’s economy. The use of nuclear weapons seems greater than at any time since the 1960s.
What is happening right now is an oil shock. The first was in 1973 with the Yom Kippur war between Israel and its neighbors (Figure 8). WTI price doubled in a month from $26 to $61 in 2022 dollars per barrel. The second was in 1980 when the Iran-Iraq war took about 3 mmb/d off the world market. Oil price increased from $61 in January 1979 to $137 by April 1980 ($2022/b). The rise of China led to the third oil shock. WTI increased from a 2003 through 2005 average price of $63 to $172 ($2022/b) by June 2008.
We are now experiencing the fourth oil shock. The removal of approximately 5 mmb/d of Russian crude oil and condensate exports would be the biggest structural change to the oil market since the Iran-Iraq war in 1980. WTI price averaged $43 in 2020 and $70 in 2021. WTI futures price is $116 this morning and Brent is $120 (March 7 2022).

I cannot speculate about how far this rally may go but the price for a $150/b June Brent call option doubled on Friday, March 4 and the cost of $180 call options jumped 100%.
Whatever the path forward, markets will be distorted substantially.
Daniel Yergin
Yergin went on to say that, “The process that began in the 1990s of Russia…being integrated with the world economy, is very rapidly going into reverse.”
Higher energy prices were likely before events in February. Even higher prices seem inevitable even in the most optimistic forward scenarios that I can imagine. The pandemic was an extraordinary disruption. The energy transition complicated its effect. The potential devolution of Russia will amplify the already fragile state of world energy and economic systems in potentially historic ways.
Like Art's Work?

Share this Post:
Read More Posts
[…] https://www.artberman.com/2022/03/07/oil-shock/ […]
[…] https://kunstler.com/podcast/kunstlercast-299-happened-peak-oil-chat-art-berman/#more-‘ https://www.mckinsey.com/industries/oil-and-gas/contact-us/~/media/10F6B7AEE60E489AAC4D4DF4DD51C1CA.ashx https://www.artberman.com/2022/03/07/oil-shock/ […]