Art Berman Newsletter: February 2023 (2023-2)

Oil prices are in a kind of sweet spot in which producers are making healthy profits while consumers no longer have to cope with the stress of the highest oil and refined product prices in many years. Yet analysts and journalists are obsessed with the possibility of much higher prices if demand from China rebounds.
Is that out of concern for the public and investors, or do they crave stoking anxiety about the next potential blow to the global economy? It reminds me of the Y2K phenomenon in which tens of billions were spent anticipating a potential end to civilization that never materialized.
I like the Saudi oil minister’s take on a demand rebound in China:
“I will believe it when I see it.”
Abdulaziz bin Salman
WTI is currently in the mid-$70s and Brent is just above $80 but Goldman Sachs expects Brent to average $105 in the second half of 2023.
“Right now, we’re still balanced to a surplus because China has still yet to fully rebound. Capacity is likely to become a problem later this year when demand outstrips supply. Are we going to run out of spare production capacity? Potentially by 2024 you start to have a serious problem.”
Jeff Currie, Goldman Sachs
In other words, the present looks just right—if a bit boring—but get ready for some largely speculative event to change all of that.
Goldman has consistently missed its price forecasts to the low side by at least 20% since June 2022. My point is not to criticize but to try to understand why analysts have been consistently wrong.
One explanation is that Goldman and most analysts are using an outdated paradigm for oil-market dynamics and price formation.

There’s nothing scientific about those exponential average curves but they faithfully reflect bullish and bearish trends. It takes time to form a new trend in which the 50-day average changes positions with the 100-day, and for the 100-day to change positions with the 200-day average curve. Until that shift occurs, we should listen to what the market is telling us instead of what analysts tell us might happen.
For example, IEA Executive Director Fatih Birol said recently, “If demand goes up very strongly, if the Chinese economy rebounds, then there will be a need, in my view, for the OPEC+ countries to look at their policies.” Those are some pretty big “ifs.”
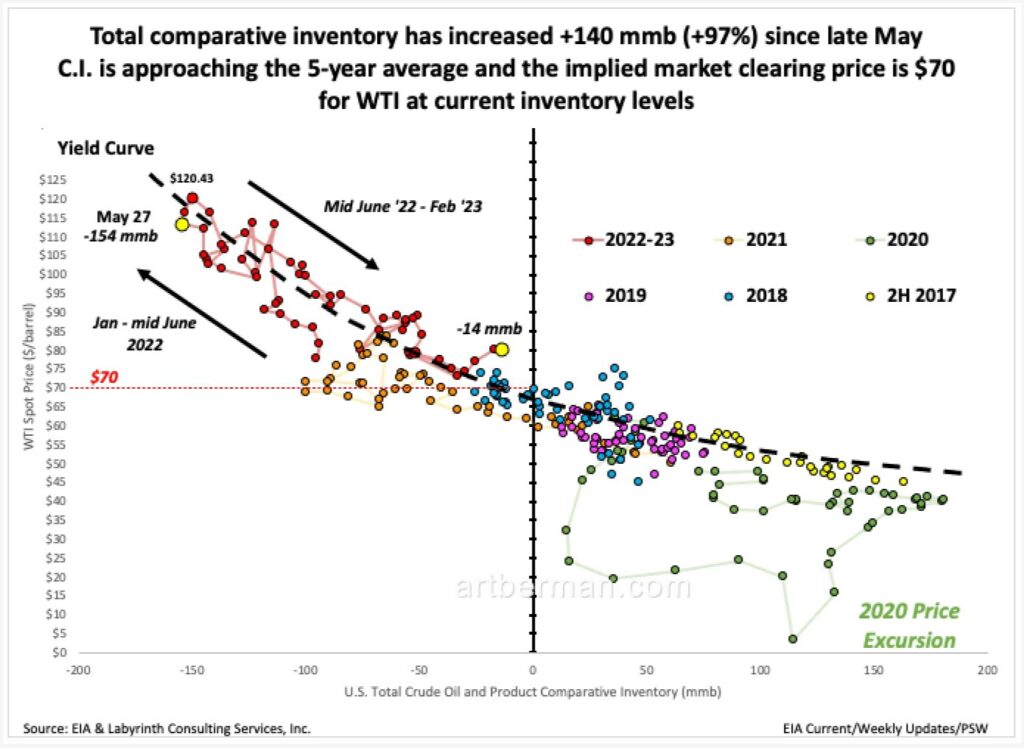
Back in the real world, U.S. comparative inventory (C.I.) has increased +140 mmb (+97%) since late May (Figure 2). C.I. is now approaching the 5-year average and the implied market clearing price is $70 for WTI at current inventory levels. SPR releases ended three weeks ago but C.I. has increased in each of those weeks. No ifs about any of that.
In addition, the term structure of WTI futures prices reflects the same bearish signal.
The WTI forward curve has been in contango since the week ending November 18. That means that the price for contracts in future months is lower than for the present month. In other words, supply is sufficient for some producers to store oil instead of selling it.
The February 3 WTI forward curve is in 5-month contango (Figure 3). The spread between the prompt March contract and the 6-month September contract increased 170% since a week ago, January 23. That is reflected in the convex shape of the near four or five months in the chart below before rolling over into backwardation.
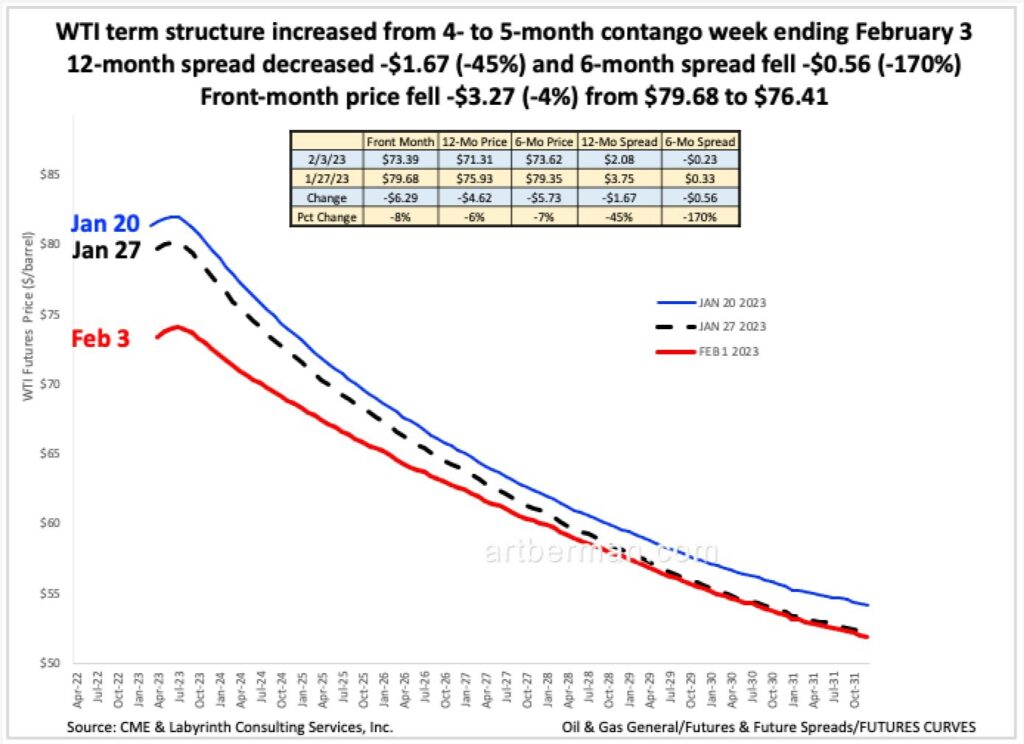
Figure 3. WTI term structure increased from 4- to 5-month contango week ending February 3. Source: CME & Labyrinth Consulting Services, Inc.
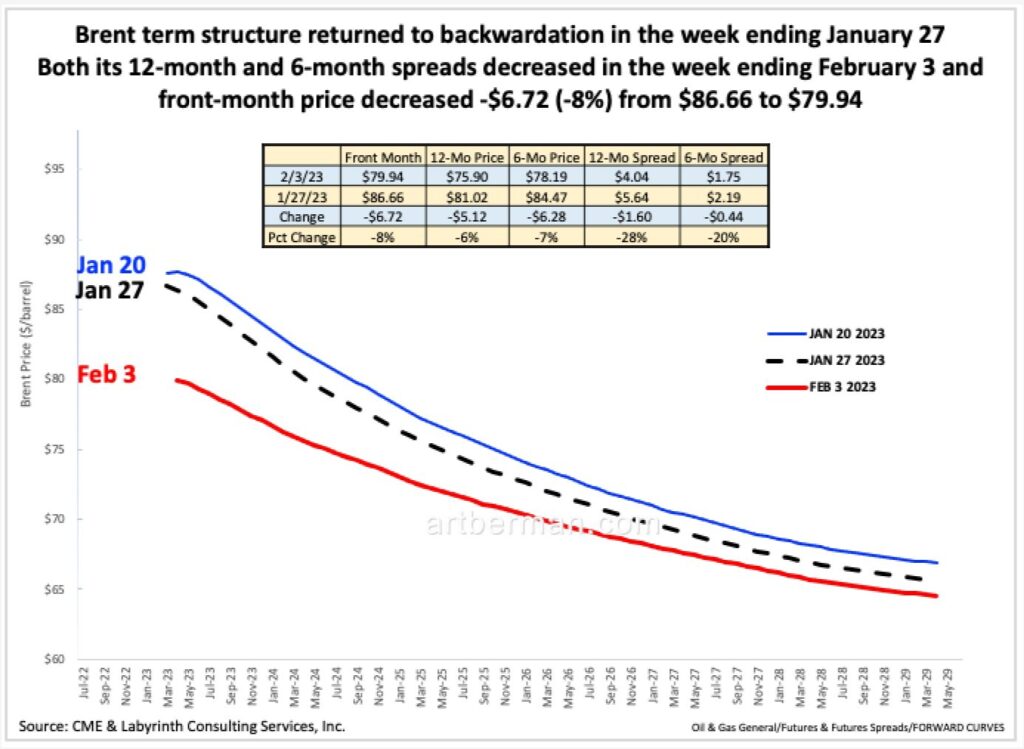
In fact, the only bullish factor that does not rely on some future speculative event is that Brent futures are in backwardation. Brent term structure returned to backwardation in the week ending January 27 but both its 6-month and 12-month spreads describing that backwardation decreased in the week ending February 3 (Figure 4). Moreover, front-month price fell -$6.72 (-8%) from $86.66 to $79.94.
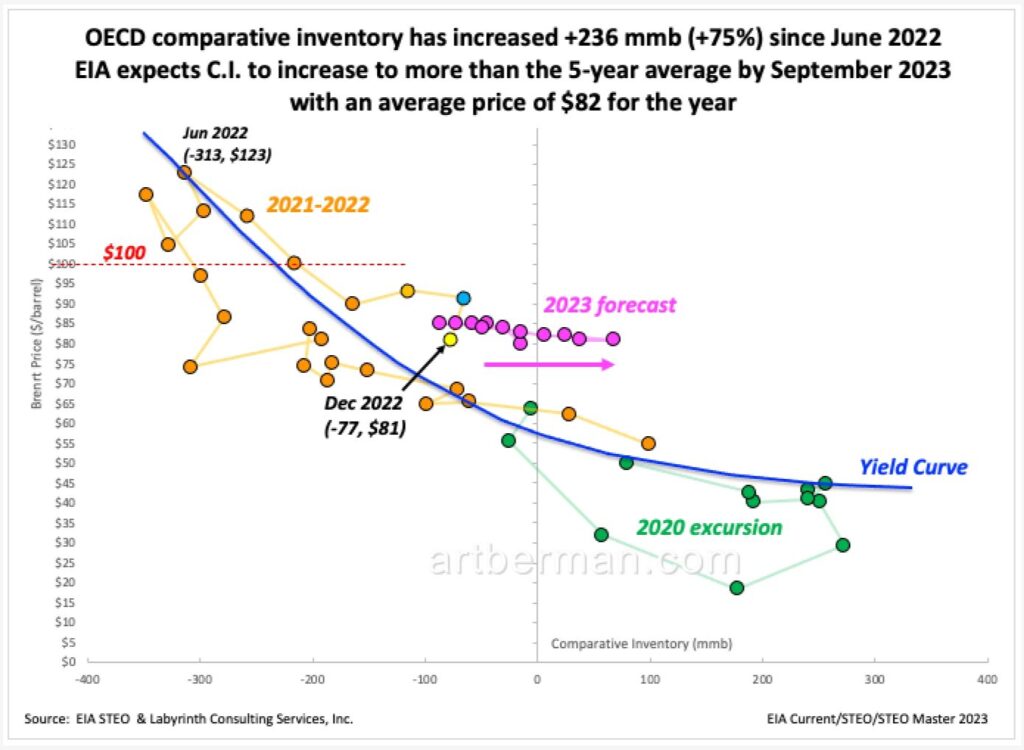
The situation with Brent-OECD comparative inventory is similar to that of WTI. It has increased +236 mmb (+75%) since June 2022 (Figure 5). Moreover, EIA expects C.I. to increase to more than the 5-year average by September 2023 with an average price of $82 for the year.
A New Market Paradigm
The objective current state of oil markets do not support a significant increase in oil prices at least until fundamentals begin to move in a different direction. But what about the longer-term concerns about supply and investment levels?
Figure 6 deserves serious consideration. It shows systematic investor retreat from the largest commodity market in the world. WTI open interest has been decreasing since mid-2018.
The April 2020 spike reflected aggressive long positioning after WTI plunged to -$37 per barrel after which open interest returned to its pre-Covid level. The unofficial end of the pandemic in early 2021 led to an increase in open interest followed by a steep decline in both open interest and net long positions since June 2021.
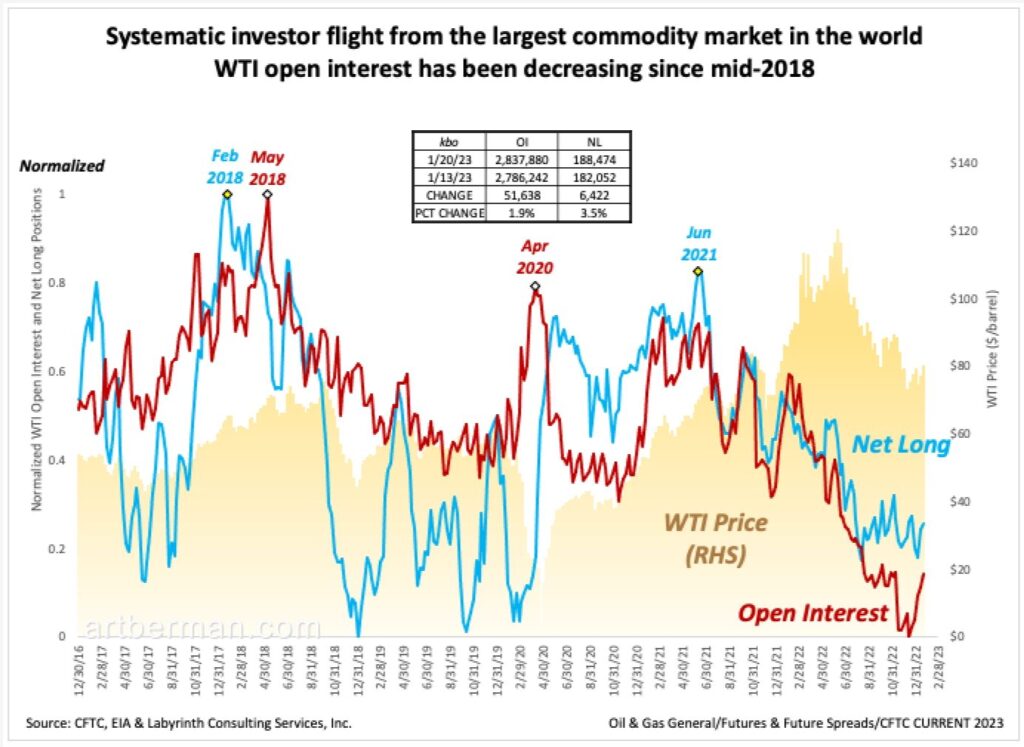
Figure 6 suggests that the oil business is on a long path toward terminal decline.
What began in 2018 as investor disaffection with a decade of poor financial returns has become a headlong flight from the petroleum energy source that supports modern civilization. Short of some unlikely moment of reckoning, investors have crossed the Rubicon and are unlikely to go back except in short-lived moments of seller’s remorse.
This is what Jeff Currie calls the revenge of the old economy.
“After the oil price collapsed in 2015, markets were fed up with wealth destruction, nearly halting deal flows across the old economy. China stopped aggressively stimulating lossmaking enterprises such as coal mines. And as climate change became top of mind, investors put greater weight on environmental, social and governance issues, further restricting capital.
“The resulting decline in investment prevented capacity growth in commodities. This has been particularly the case in hydrocarbons where divestiture by investors for ESG reasons compounded an already growing under-investment problem.”
Currie and other analysts expect a surge in commodity prices that will mark the beginning of a commodity super-cycle.
The argument is logical and compelling but assumes that the dynamics of the old economy’s market paradigm is still valid. I’m not so sure about that.
As Arjun Murti recently noted,
“There is zero chance the world can live with disincentivized traditional energy sector CAPEX.”
Let that sink in. Market forces cannot solve the gap between energy supply and demand. There is no oil price that will provide the necessary incentive for drilling and production to catch up with anticipated oil demand.
I suspect that Murti sees potential for a favorable resolution in more energy-friendly policies and a new investor approach to funding beyond just ESG projects.
I hope that he’s right but I am skeptical. The clash between the old and new world orders goes well beyond the armed conflict in Ukraine. The focus by leaders on both sides is to increasingly meddle in complex systems like energy, currency, banking and finance. The potential for unanticipated consequences is extreme.
Saudi oil minister Abdulaziz bin Salman noted last week that,
“All these sanctions, embargoes, they all will convolute into one thing and one thing only: lack of energy supplies of all kinds when they’re most needed.”
Trafigura’s co-head of oil trading Ben Luckock stated last week that,
“We are building a deep inefficiency into an oil market that has spent decades becoming incredibly efficient…This will get worse over time.”
I would have thought that the energy crisis that followed the global pandemic and the Ukraine war would have created a heightened sense of energy awareness among world policy makers. Instead, it has led to a series of policies that double down on green energy investment and that frustrate timely and affordable oil supply to the world.
No one knows how this may end but I suspect that we have reached a point of no return for oil. Policy makers and the public believe that renewable energy is the solution to the world’s energy and climate problems. They simply don’t grasp that green energy is great for electric power generation but not for the other 80% of the world’s energy needs.
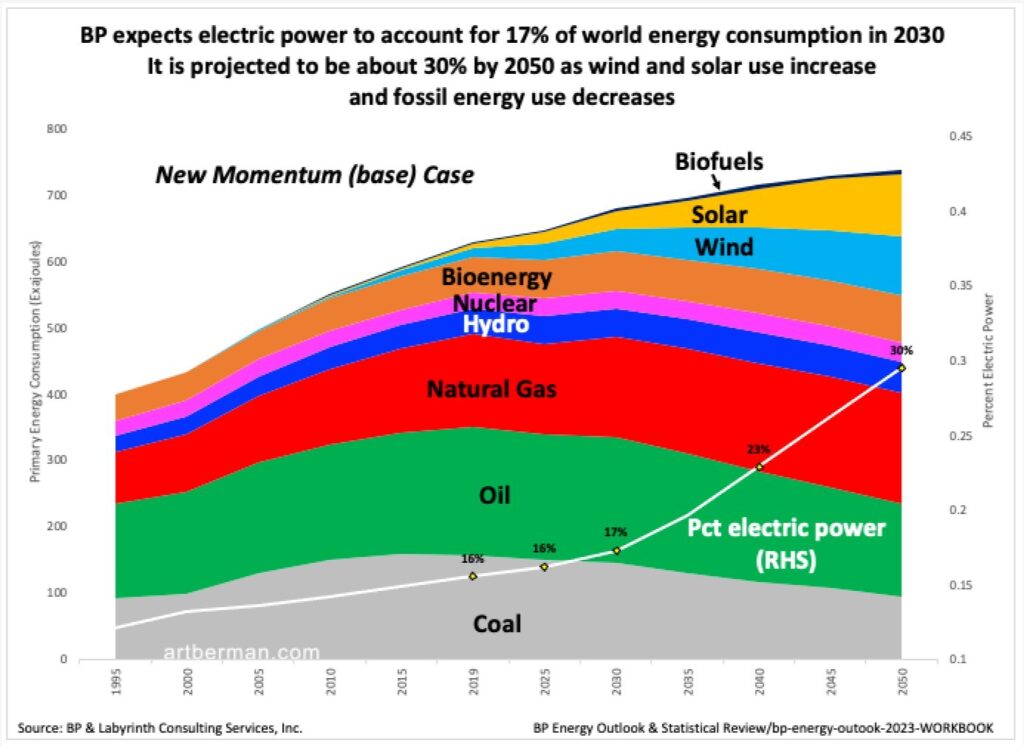
Last week BP published its Energy Outlook for 2023. It shows an expansion of solar and wind, and a decrease of coal and oil going forward. At the same time, electric power will only account for 17% of total world energy consumption in 2030, 23% in 2040, and 30% in 2050 (Figure 7). This very optimistic projection still indicates that fossil fuel dependence will remain at an average of 72% of total energy use through 2040.
It is tempting to assume that inadequate exploration and production investment will lead to “a serious problem” as Currie suggests; and that can only mean much higher oil prices using his and most of the oil industry’s existing paradigm.
What if that paradigm is no longer correct? What if demand follows supply lower as it did during the last five oil-price shocks from 1974 to 2020?
That seems more consistent with the patterns that have dominated oil markets since the middle of 2022 than some speculative super-cycle that takes oil prices beyond the affordability limits of a fragile global economy.
Like Art's Work?

Share this Post:
Read More Posts
Can demand follow supply lower? That can certainly happen. Demand depends on affordability. In a weakened or depresssed world economy oil becomes unaffordable for large segments of the population, except at very low prices.
Ed,
Not only ‘can’ but ‘has’ historically whenever there is a price shock.
Best,
Art
the dynamics you lay out are multiple years into the future…with global demands for electrification increasing how would society writ large manage to decrease consumption for multiple years or decades…difficult to imagine anything but a short term decline in demand in respond to prices??