Banking Crisis: Oil Market Over-Reaction or Restraint

Things have gotten ugly for oil markets partly because of the current banking crisis.
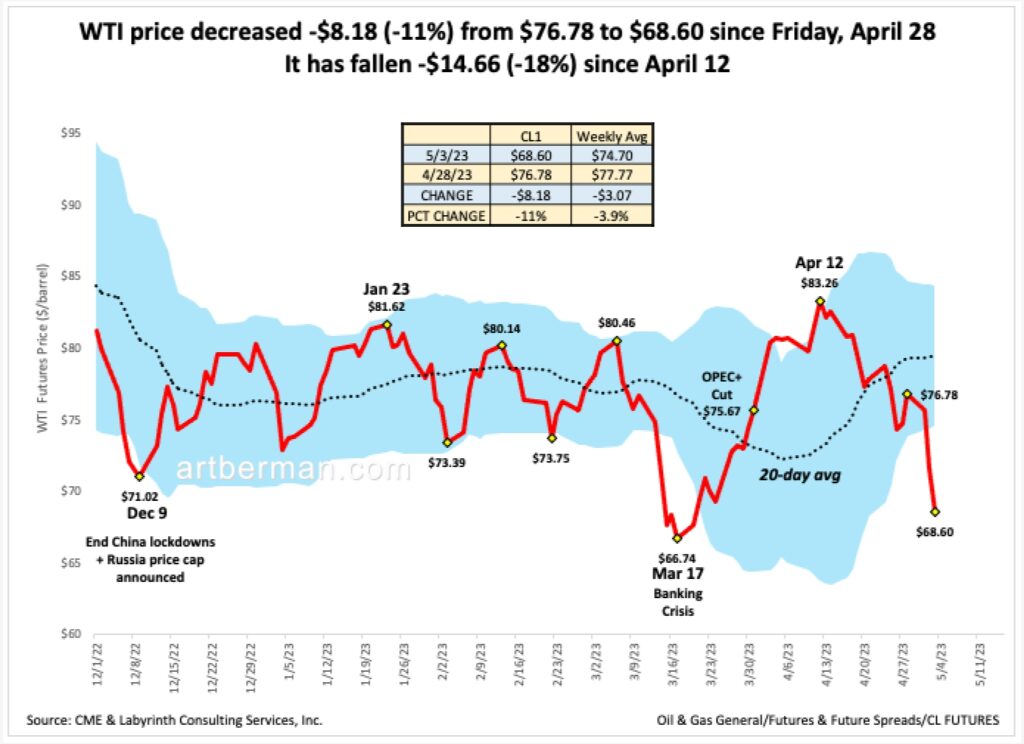
WTI price decreased -$8.18 (-11%) from $76.78 to $68.60 since Friday, April 28 (Figure 1). It has fallen -$14.66 (-18%) since April 12. It’s almost a repeat of the March price collapse from $80.46 to $66.74 when the U.S. banking crisis first entered the news cycle.
Are markets over-reacting?
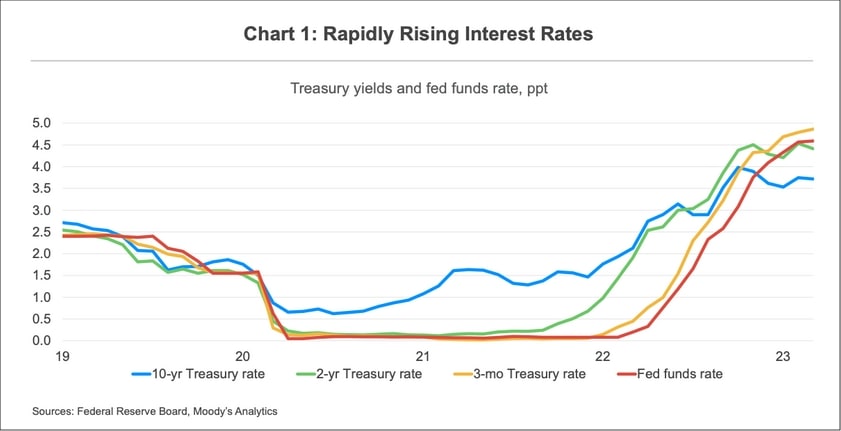
In order to put this in perspective, it’s important to understand that banks are in fact leveraged bond funds. For the last several years, they used investor deposits—for which they paid very little interest—to buy bonds, mortgages and other long-term fixed assets on margin from which they got back considerably more interest (Figure 2, blue vs red curves 2020-2022).
This has been a relatively low-risk model. Depositors rarely checked their rate, didn’t ask for more and rarely moved their money.
Since the Federal Reserve Bank started raising interest rates, this has changed. Ten-year bond rates have nearly tripled from 1.3% in Q3 2021 to 3.8% in Q4 2022. For some banks, their long-term, low interest assets have become almost worthless. Meanwhile, the federal funds rate–the rate at which banks borrow–has increased more than 30-fold from 0.12% in early 2022 to 4.5% in early 2023. The spread between the interest rate on investments and their cost of borrowing has become much less favorable (blue vs red curves in Figure 2, 2022-2023).
With higher interest rates, cash has become an asset for investors for the first time in more than a decade. Depositors have been moving their money in and out of banks to maximize the rates they are paid. For banks like Silicon Valley Bank (SVB), cash withdrawals combined with falling asset values drove them into a liquidity crisis.
“As interest rates rose rapidly last year, the marked-to-market value of the securities declined along with SVB’s capital cushion.”
Moody’s Analytics
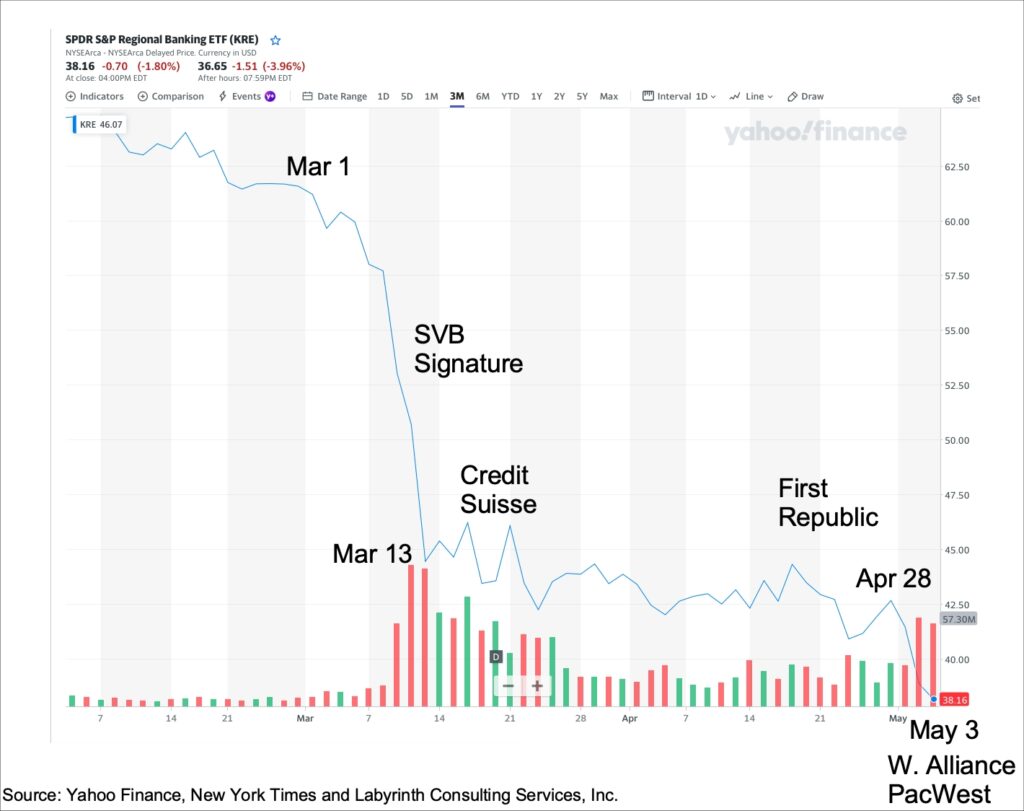
Figure 3 shows the time line of bank failures and the price decline of the KRE regional banking fund. Silicon Valley Bank, with assets of $209 billion, collapsed on March 10, 2023. It was followed by Signature Bank ($110 billion) and Credit Suisse ($1.3 trillion). First Republic Bank ($229 billion) was seized by the FDIC on May 1 and now, Western Alliance Bancorp and PacWest Bancorp appear on the verge of collapse.
This week, J.P. Morgan Chase CEO Jamie Diamond said about bank failures, “There may be another smaller one, but this pretty much resolves them all. This part of the crisis is over.”
What about the next part of the crisis?
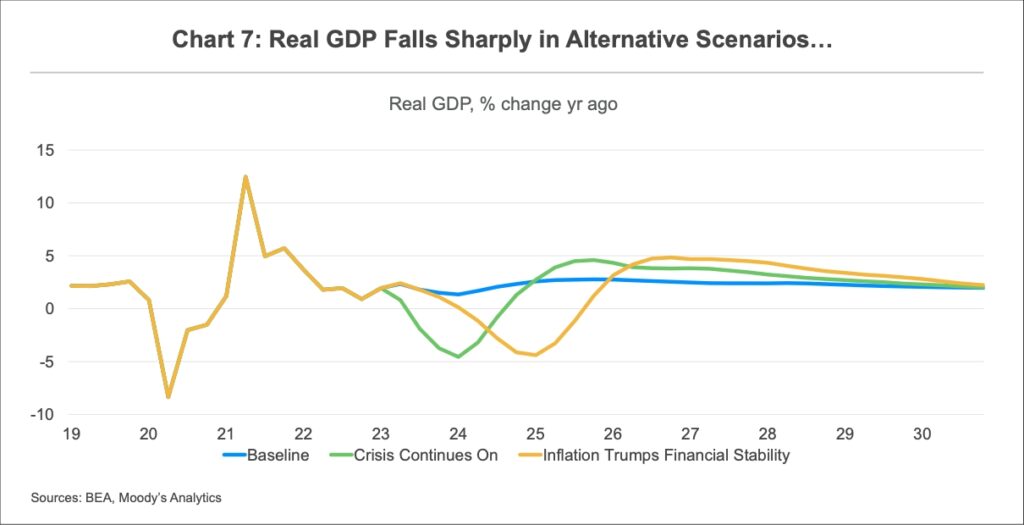
Moody’s Analytics modeled some scenarios which assume that the crisis is not over. These suggest that a U.S. GDP decline of as much as 5% is possible over the next two to three years (Figure 4). Moody’s most likely case (blue curve), however, shows a slight decline in 2023 and 2024 and then, a return to 2-3% annual growth.
Its alternative scenarios—the green and gold curves in Figure 3—would result in negative GDP growth, something that hasn’t happened since 1947.
Moody’s analysts explain it like this:
“The dramatic tightening in financial conditions and the collapse in confidence cause consumer spending and business investment to plunge, leading to a sharp decline in GDP, the loss of millions of jobs, and surging unemployment. A severe recession begins by the third quarter of this year.”
–Moody’s Analytics
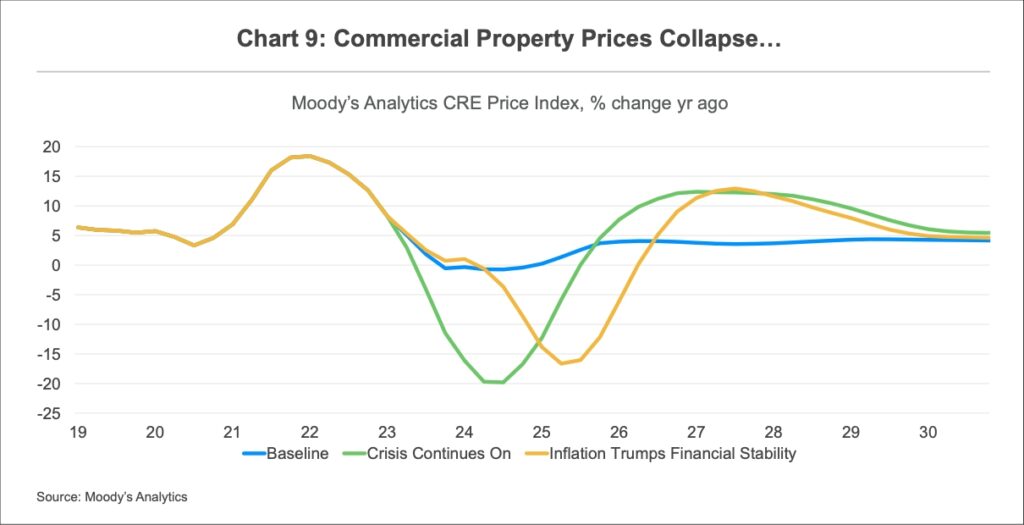
As if this is not bad enough, a larger risk may lie in the commercial real estate market. An over-supply of office space in many U.S. cities since the 2020 pandemic has occurred largely because of people working-from-home and quitting their jobs in the Great Resignation.
“50% of people haven’t gone back to office…and, as leases come up for renewal, they will just not be renewed, leaving a long-tail of non-performing loans on the books of the regional banks…There are $2 trillion of loans to the CRE sector in the smaller banks…Low rates will [not] get people back to the office. The world has changed.”
Raoul Pal
Figure 5 shows that commercial property prices could collapse by 15-20% in Moody’s alternative scenarios. That may be a conservative estimate.
Danielle DiMartino Booth recently explained what is happening in commercial real estate markets:
“If the heat is maintained on regulators…then it’s perfectly logical to continue to see a more rapidly unfolding commercial real estate cycle than we ever have in modern history.”
If this happens, Raoul Pal believes that the Federal Reserve is going to have to take non-performing loans onto their books to keep the system solvent.
“I just don’t see an outcome to this banking mess without a few more Trilly tacked onto the Fed balance sheet over the next 18 months and rates slashed.”
Raoul Pal
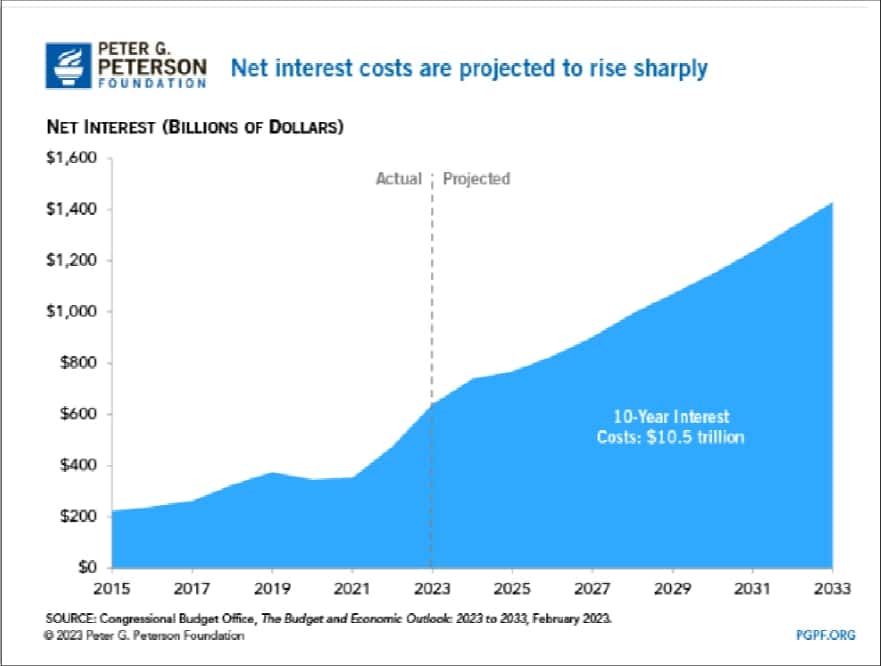
In February, the Congressional Budget Office estimated that U.S. net interest costs may average an additional $1 trillion per year over the next 10 years (Figure 6). That did not include costs from new borrowing because of the banking and commercial real estate crises.
Although reality may not be as bad as these scenarios suggest, this is what is bothering oil markets and driving prices lower.
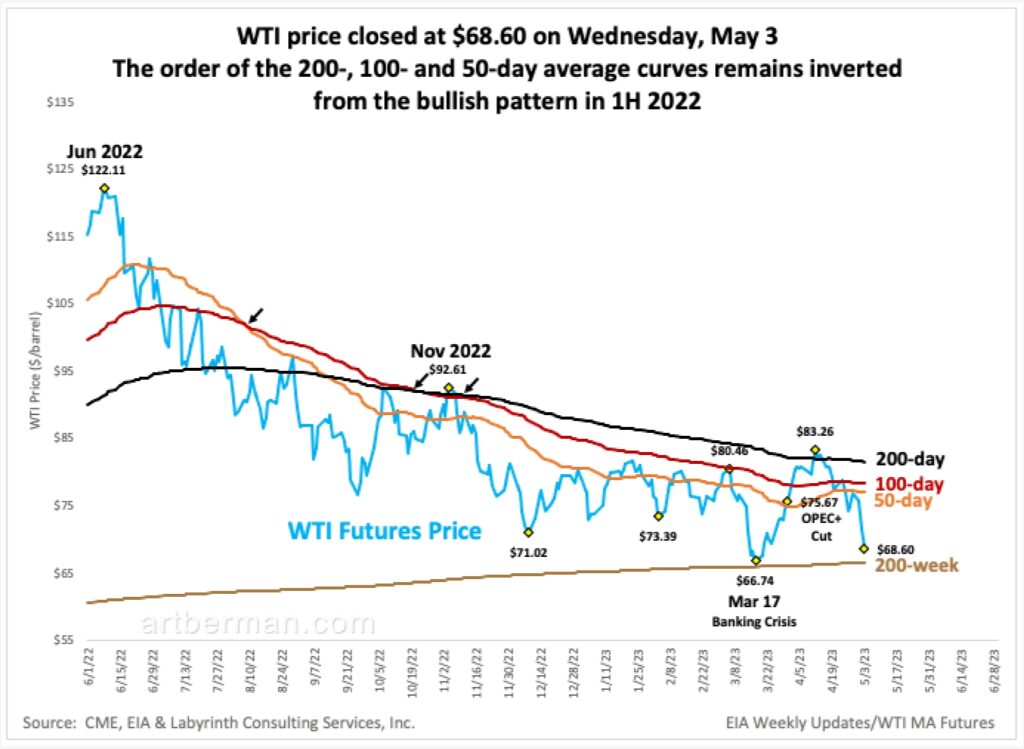
Figure 7 shows the WTI futures price decline from $83.26 on April 12 to $68.60 on May 3. During a bull market, the 50-day moving average is above the 100-day average which is in turn above the 200-day average. Since November 2022, this order has been inverted and that describes a bear price market.
These relationships are purely empirical but demonstrate how much things must change to approach the calls for $90 or $100 oil prices made by some analysts for the second half of 2023. Two- to ten-month averages do not change quickly.
Energy is the economy and oil is the energy master resource but only refineries buy crude oil. Consumers buy products made by refiners, and transport fuels account for about 74% of petroleum product consumption.
Figure 8 shows that neither U.S. transport fuel consumption nor refinery intakes have recovered to pre-pandemic levels. That reflects a weakening of oil demand and a weakening of the economy more generally.
Yesterday, John Kemp reported that “U.S. manufacturing and freight activity has declined for six months running, which is being reflected in falling consumption of diesel and other distillate fuel oils as well as industrial electricity sales.”
“The decline in energy use confirms the industrial side of the economy is in the middle of a broad-based and sustained downturn.”
John Kemp
Money is a claim on the work that comes from energy, and debt is a lien on future work from energy.
It’s easy to forget that in the context of the billions and trillions of dollars that governments now spend kicking society’s increasingly frequent crises down the road. The amounts are so great that they seem unreal. That sense is amplified because the money can apprently be produced from thin air. Yet every dollar is a claim on present or future energy.
As long as we trust that the resources behind those claims exist, this bailing out and backstopping can continue. But trust is a fragile thing.
Covid and the Ukraine war caused some awakening about how energy affects people’s daily lives. Yet economists and policy makers fail to make the crucial connection between money and energy.
Maybe all of the problems that I have described in this post will work out with relatively limited damage to the world. Still, the financial claims have been staked and will not slip into history like the events that caused them.
This is the lens through which I try to view the daily news cycle and how it applies to oil. While many seem puzzled by the 11% decline in oil prices since last Friday and think the market has over-reacted to the banking crisis I see its reaction as one of surprising restraint.
Like Art's Work?

Share this Post:
Read More Posts