The Great Artificial Oil Price Rally

Happy days are here again! Goldman Sachs is calling for $80 Brent price and Citigroup expects record oil demand in the third quarter of 2021.
The problem with these forecasts is that the oil-price rally that began in April 2020 is mostly artificial.
When price fell from $60 in late February to -$38 two months later, it’s hard to call a return to $60 a rally. It’s really a just a recovery. Without OPEC+ withholding 8 to 10 mmb/d since April 2020, it’s doubtful the price recovery would have gotten much past $40 per barrel.
Record oil demand seems improbable since no one expects air travel to fully recover in 2021 and it accounted for about 8 mmb/d of global oil consumption in 2019.
Goldman Sach’s $80 forecast is plausible but it ignores that OPEC spare production capacity is at record levels. It reached 9.2 mmb/d in June 2020 and the March level of 8.5 mmb/d is about eleven times more than the 1.6 mmb/d the last time Brent price was at $80 in November 2018 (Figure 1).
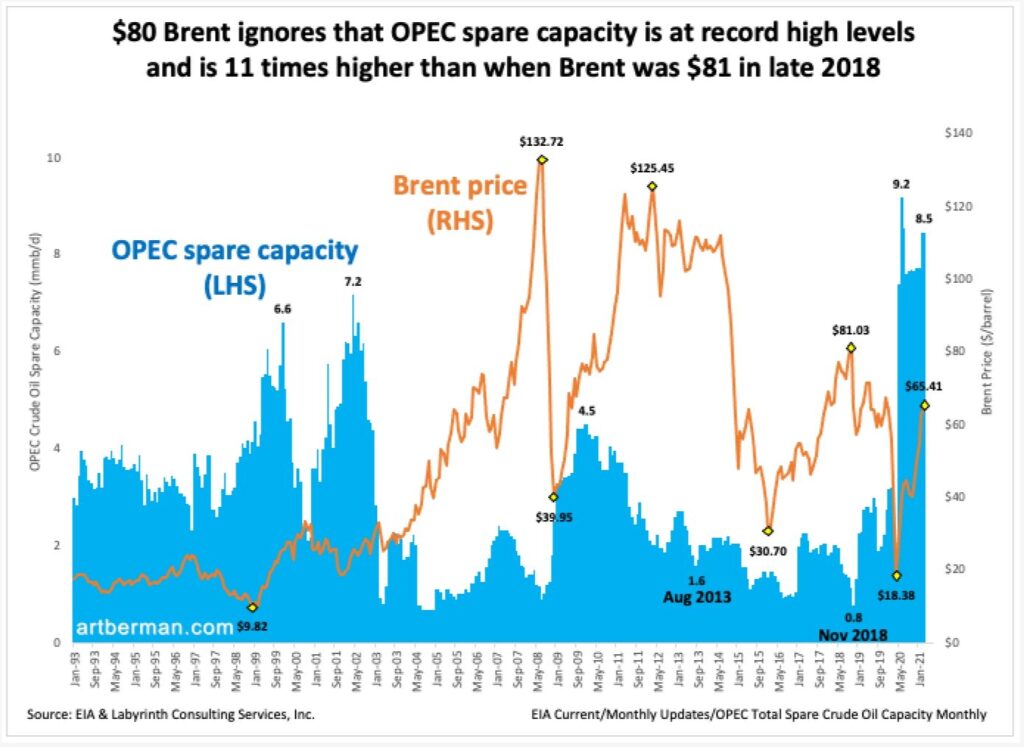
Spare capacity is part of supply and the 8.5 mmb/d of crude oil spare capacity in Figure 1 is equivalent to about 10.5 mmb/d of total liquids. World production of 93.5 mmb/d in March would have been almost 104 mmb/d without OPEC+ constraints.
Markets know this so why would they pay $80 per barrel with an 11% surplus in OPEC’s back pocket?
Citigroup’s view is that demand for oil will explode now that Covid vaccines are available. I expect demand to improve but not even the most optimistic forecasts suggest that it will return to pre-pandemic levels any time soon.
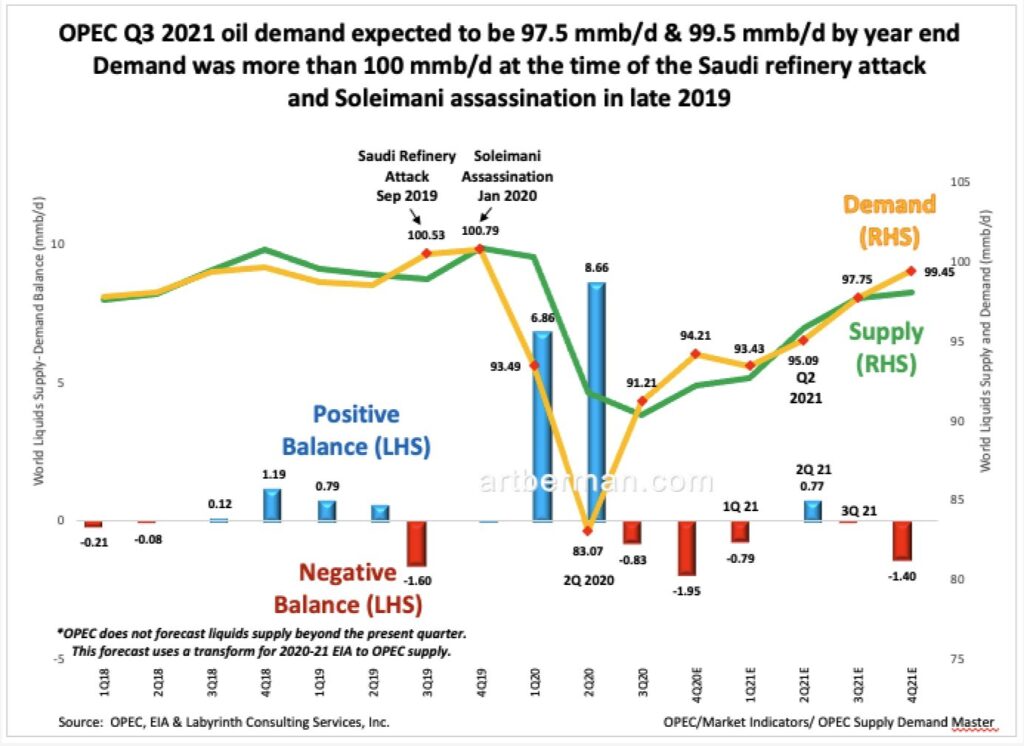
Figure 2 shows OPEC’s latest demand forecast and EIA’s supply projection. Oil demand was more than 100 mmb/d in the final two quarters of 2019. It is about 7 mmb/d lower now in the first quarter of 2021 at 93 mmb/d. OPEC expects it may rise to 97.75 mmb/d the third quarter. It’s forecast for 99.45 mmb/d in the fourth quarter represents an upward adjustment of +1.5 mmb/d since last month’s estimate. If true, that’s a big improvement but hardly the record demand levels proclaimed by Citigroup.
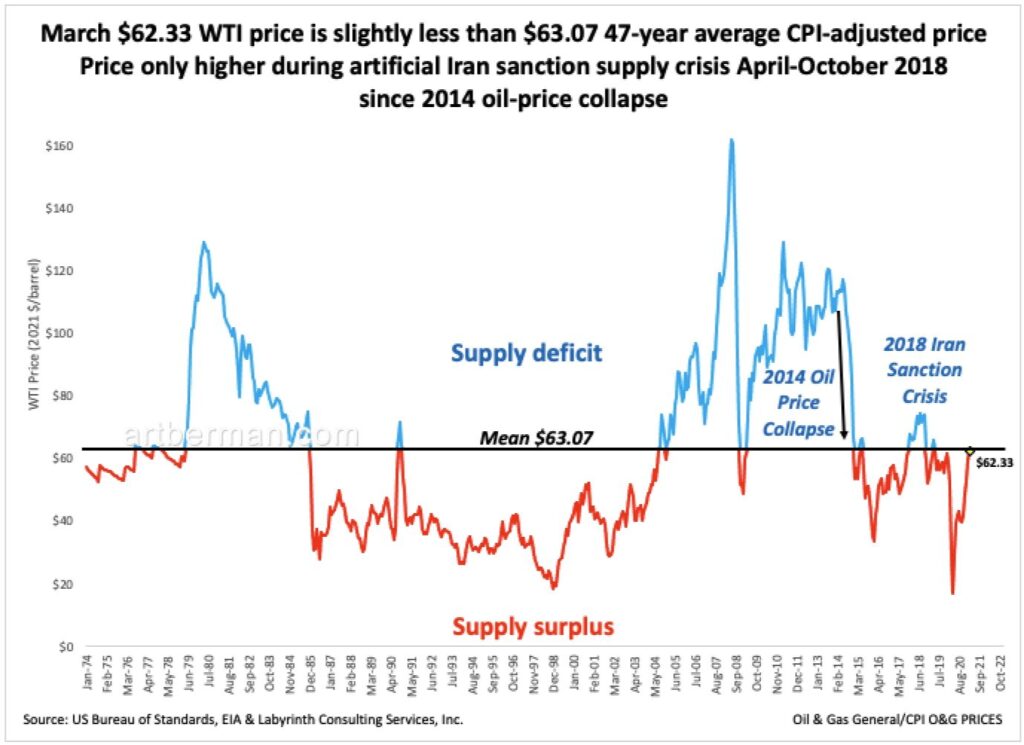
The celebratory mood among analysts and journalists further ignores that current oil price is approximately the long-term average price. The CPI (consumer price index)-adjusted price of WTI since 1974 is $63.07 per barrel. The March average price was $62.33. The April 20 closing futures price was $62.44. There is nothing extraordinary about oil prices except that they have recovered from the lowest levels ever a year ago.
Oil prices cannot be whatever people think they should or might be. They are constrained by storage levels. OPEC knows this. That’s why it targets inventory because lower inventories will result in higher oil prices.
Higher price is not arbitrary or capricious. It is a cheerless and grudging matter for markets and done only when absolutely necessary.
The beauty of comparative inventory (C.I.) is that if you tell me a price that you think oil may be, I can tell you what has to happen to C.I. in order to get there. I have discussed the details of comparative inventory in a recent post.
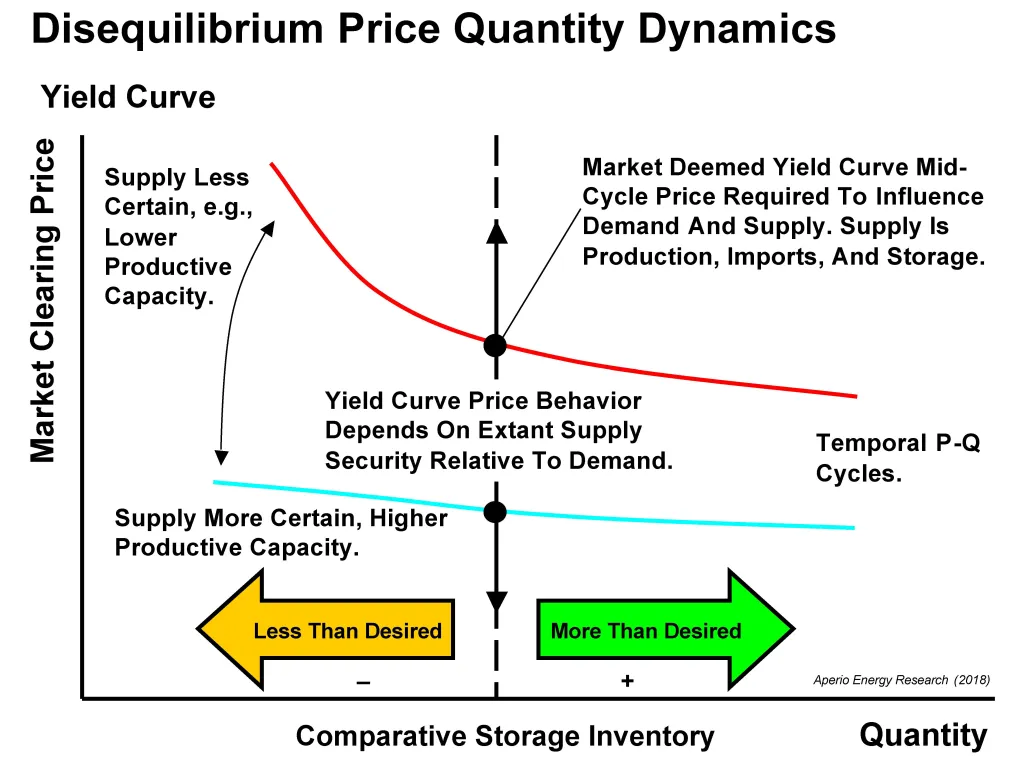
Figure 4 shows the relationship between WTI spot price and total U.S. petroleum inventory from 2014 to the present. Two yield curves describe different periods of price formation. The red curve fit 2014 through 2016 data based on the market’s sense of supply urgency. The blue yield curve fits 2017 through present price-volume data. It reflects a lower sense of supply urgency than the 2014-2016 yield curve.
The March price-volume data point is shown in yellow with it’s $62.71 price annotated. If comparative inventory continues to decrease to the 8-year minimum, price will probably not exceed $70 per barrel. The data point by the blue arrow near the text “2018 Iran Sanction Excursion” represents the maximum price of $74.08 in July 2018.
The chart suggests that there is little possibility that WTI can get to $80 per barrel or more at any comparative inventory value unless markets re-value oil to 2014-2016 supply-urgency levels. Although that is possible, it seems unlikely given the amount of spare capacity that OPEC+ has withheld from the market since March 2020.
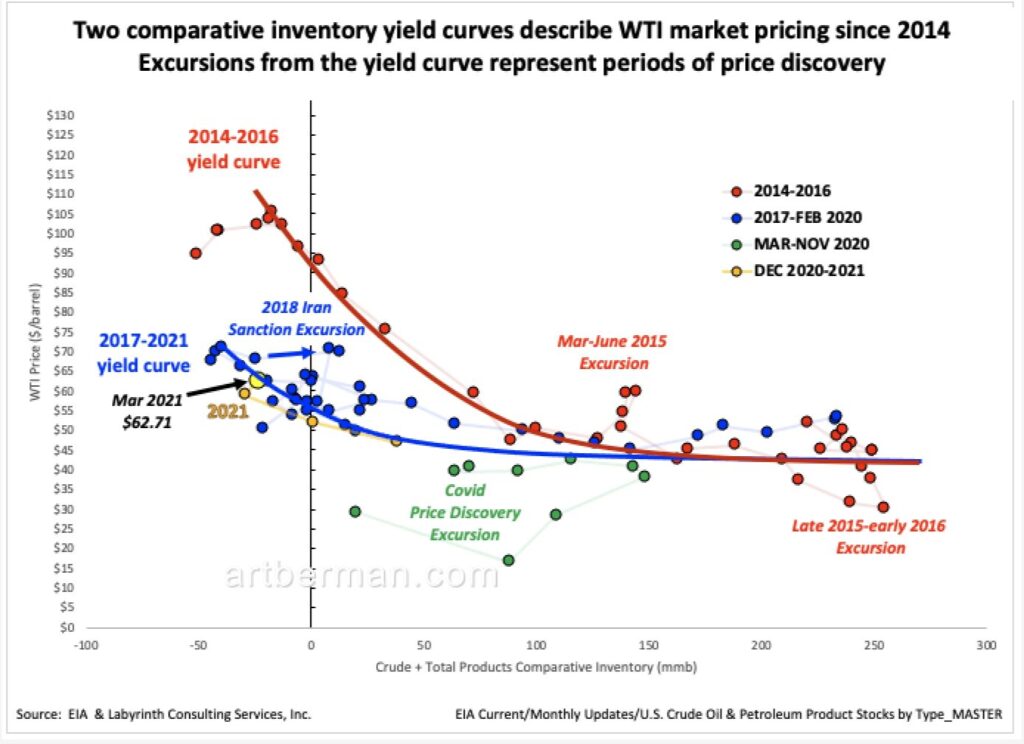
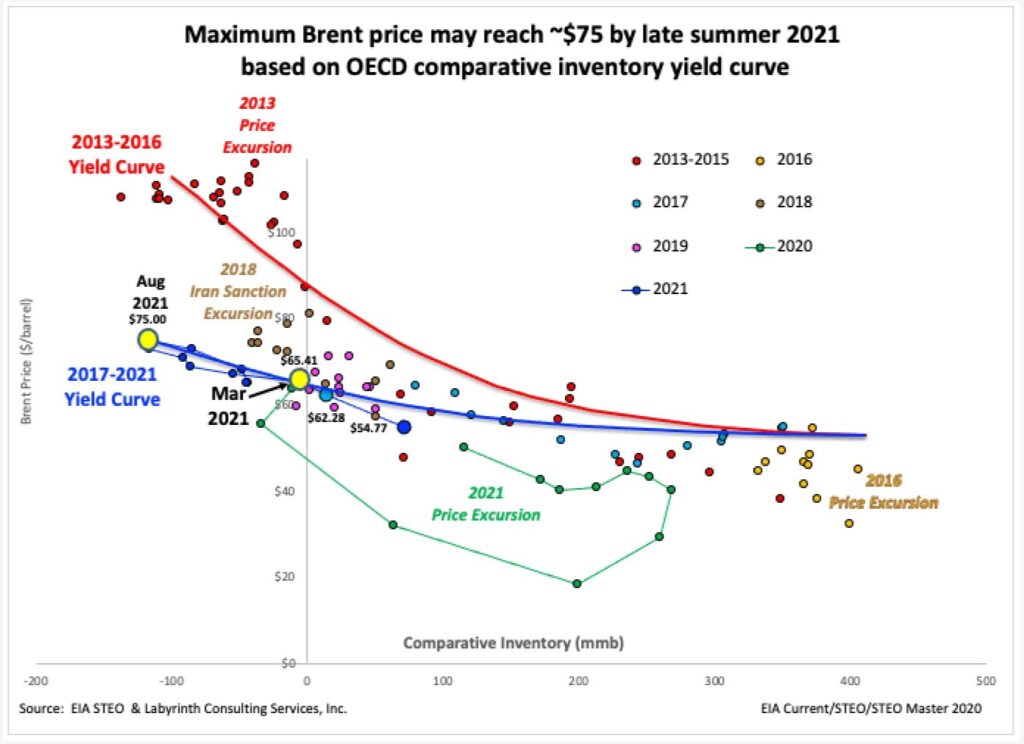
Figure 5 shows the relationship between Brent spot price and OECD total commercial inventories. Unlike Figure 4, I have used EIA inventory forecasts and my own Brent price projections for 2021 beyond March. The March price-volume data point is shown in yellow with it’s $65.41 price annotated.
If comparative inventory continues to decrease, as EIA expects, the August 2021 price will probably not exceed $75 per barrel. That data point is shown in the second yellow dot near the text “Aug 2021”.
There are some who dismiss comparative inventory as a “backward-looking” method. I hope that I have shown its value in making reasonably calibrated estimates of future price based on previous and projected inventory data.
Another common objection to comparative inventory is that the yield curves are not a perfect mathematical regression. They are not supposed to be. Markets consist of people and human behavior does not follow regression algorithms. Price excursions—or deviations from the yield curve–are as important as price-volume data that falls on the curves.
Excursions represent periods of price discovery. When traders perceive that something has changed, they will bid prices up or down until no one is willing to take the other side of the trade. Then, price-volume data either reverts to the yield curve or moves to a new one if the discovery process reveals a new sense of supply urgency that warrants higher prices.
That does not, of course, mean that what I have shown is correct. It does suggest plausible scenarios that do not include the kind of unconstrained price forecasts often cited in the industry press.
The main point is that there is nothing extraordinary about current price or inventory trends. Relatively tight physical supply is entirely artificial because of OPEC+ production and export constraints. That said, none of the inventory projections presented discount those constraints at all.
The important yet simple take-away is that markets are not nearly as suggestible as most analysts and investors. Markets use price as a signal to producers to drill more or fewer wells in order to ensure future supply. Markets are not like the impatient person in an elevator who repeatedly presses a button for his desired floor thinking that somehow he will get there sooner. The elevator gets the signal the first time.
Similarly, once a price signal has been sent to producers, markets do not continue pressing the button with higher prices imagining that drillers are able to drill more wells faster as a result. Recently, 152 U.S. oil company executives told the Dallas Federal Reserve Bank that they were profitable at $52 per barrel WTI price. Why should markets pay more when there is already a healthy profit margin in the $60 to $65 range?
Markets are cheap and hate to over-pay. That is the basis of price formation.
Like Art's Work?

Share this Post:
Read More Posts
[…] есть и более скептически настроенные эксперты. Их позиция построена на […]
[…] Others are more skeptical as coronavirus cases in India are now rising and European countries are looking to place more restrictions on travel. […]
[…] Others are more skeptical as coronavirus cases in India are now rising and European countries are looking to place more restrictions on travel. […]
[…] Others are more skeptical as coronavirus cases in India are now rising and European countries are looking to place more restrictions on travel. […]
[…] Others are more skeptical as coronavirus cases in India are now rising and European countries are looking to place more restrictions on travel. […]
Record oil demand seems improbable since no one expects air travel to fully recover in 2021 and it accounted for about 8 mmb/d of global oil consumption in 2019.
The greatest oil demand increase today and in the future is not about global aviation for the masses coming back in 2021, ever or not, but rather about the fact we are mining coal reserves at greater depths and less seams, greater overburdens to be removed, heavier machinery removing them quicker, and transporting farther whatever the less and less coal found.
And that is all oil and heaps of other oil-run externalities, including the army of >500 million workers running the media in all social and classic channels in all languages, huge political systems on-the-pay-rolls, repairs against wear and tear in the system, countless others – and wars!
We also burn more oil to get less oil – to that extent we flare infinitely precious and badly needed gas from oil wells in the air like no tomorrow – as if we are looting the oil and we need to quickly get away with it from the crime scene.
The revenue from all that oil produced is not even enough to manufacture and bring the technology that captures the flared gas.
Our civilisation will likely drain all the oil in the Middle East in no time just to enable China importing 17.5+ million barrels daily and produce 4+ billion tonnes of coal yearly, and India importing 4.5+ million barrel daily and producing few more billions of coal every year.
Actually, it looks like this is no less than the point in the history of our civilisation where it has reached the stage of fossil fuels production is colossally intensified for the sake of fossil fuels production.
Stopping Aviation for the masses and reducing daily driving worldwide will never be enough to allow this fossil fuels for the sake of fossil fuels going on very far.
This becomes extreme when it feels today we are now pushed to even kill each other to spare some oil supplies – instead of understanding what’s going on with the Energy Question.
This video shows armadas of Iranian drones mobilised in Iraq, remotely controlled from Tehran.
As light drones cannot fly long distances, local observers understand the drones are meant to soon kill as much as possible of civilians in Iraq – under the pretext of fighting the US, Israeli or Saudi presence inside that miserable oil-rich country.
The oil price range from $30 to $80 is actually no more than what buys few Big Mac meals.
Does anyone really believe that if we top up a barrel of oil with few Big Macs it will make all the difference for the world when we throw millions and millions of tonnes of food and packages in the bin daily?
Economics has become today a giant Enron – as fossil fuels become harder and harder to produce.
Physics rules – and humans will never be able to manufacture Energy.
A long term solution, and even a new social contract seem badly needed – pronto.
Wailing.
Is this a comment or a post?
Best,
Art
Ben,
This is the most desperate OPEC has ever been. Also, Abdulaziz bin Salman is an excellent whip. It cannot last forever because a market the size of oil cannot be managed but rumors of its demise have been exaggerated for decades.
Best,
Art
To their credit this might be the most successful Opec has ever been at manipulating the price. How long can they keep it up is the question?
Thanks Art.
Art, where does supply and demand fit in?
Would you oversupply a market when demand was weak?
If you had any common sense probably not.
What about US shale never being free cash generating, but producing oil at a loss to crash the oil price, (failed economic warfare) unless you live in Venezuela.
How can the world’s biggest oil exporter go from hero to zero?
I see the US banks are not rushing in to back a loss making venture unless free money is available from the FED.
It would be prudent to produce enough to satisfy demand make a decent profit and be happy with that.
That is unless anti capitalist tendancies are your thing then a temptation to over produce minimise profits and reduce the oil price for the benefit of the people might seem appealing.
Thanks for your questions. Supply and demand was shown as Figure 1. Typically, supply dominates oil markets, not demand although most analysts don’t seem to understand that based on their obsession with demand. Profit is less important than capital for oil production. The hero always has an inferiority complex. When economic growth goes to zero, there will be enthusiasm for oil again.
Best,
Art
Great post Art, thank you for sharing.
I’m wondering if you have ever tried to analyze what might be an avarage or typical „price discovery excursion” in terms of number of observations or in terms of positioning measures (e.g. everything above +/- 1.5 standard deviation)? If you’d find some distribution of such excursions then maybe clearing data out of the excursion outliers would make it possible to produce a more objective regression? I know it’s all behaviourally driven but a more automated approach could possibly take some criticism down if you care at all 🙂
Regards,
Thanks for your comments. There are really no typical excursions especially after the 2020 event that lasted a year and involved 4 or 5 standard deviations from the previous norm. In general, excursions may involve 30% price variance and may last 3 months.
Best,
Art