Art Berman Newsletter: April 2023 (2023-4)

The world got a surprise last weekend from OPEC+. It’s going to cut more than 1 mmb/d of oil output beginning in May. That confirms what I’ve been saying for months: the oil market is over-supplied.
Meanwhile, analysts persist with their Groundhog Day message of a tight supply and higher oil prices just around the corner. Goldman Sachs raised its Brent price forecast by $5 to $95 for December 2023. Bank of America suggested that a supply cut of 1 mmb/d equates to a price change of $20 to $25 per barrel.
Those who focus more on fundamentals than price have reached the stunning conclusion that the OPEC+ cuts will lead to supply-demand deficits in the second half of the year but this is the same story they’ve been telling for months.
Most of the commentary already this week suggests that higher prices were the main objective behind the output cuts.
“Officially, the cartel wants price stability in oil markets. But in reality, they simply want higher prices.”
Ipek Ozkardeskaya, Swissquote Bank
Analysts are quick to disparage OPEC+’s stress on price stability but that explanation is sensible considering the 16% drop in oil prices since early March to the lowest level in 15 months.
Another narrative is that the production cut was intended to safeguard against a price collapse.
“It really puts a floor under the price of oil long term.”
Joseph Sykora, Aptus Capital Advisors
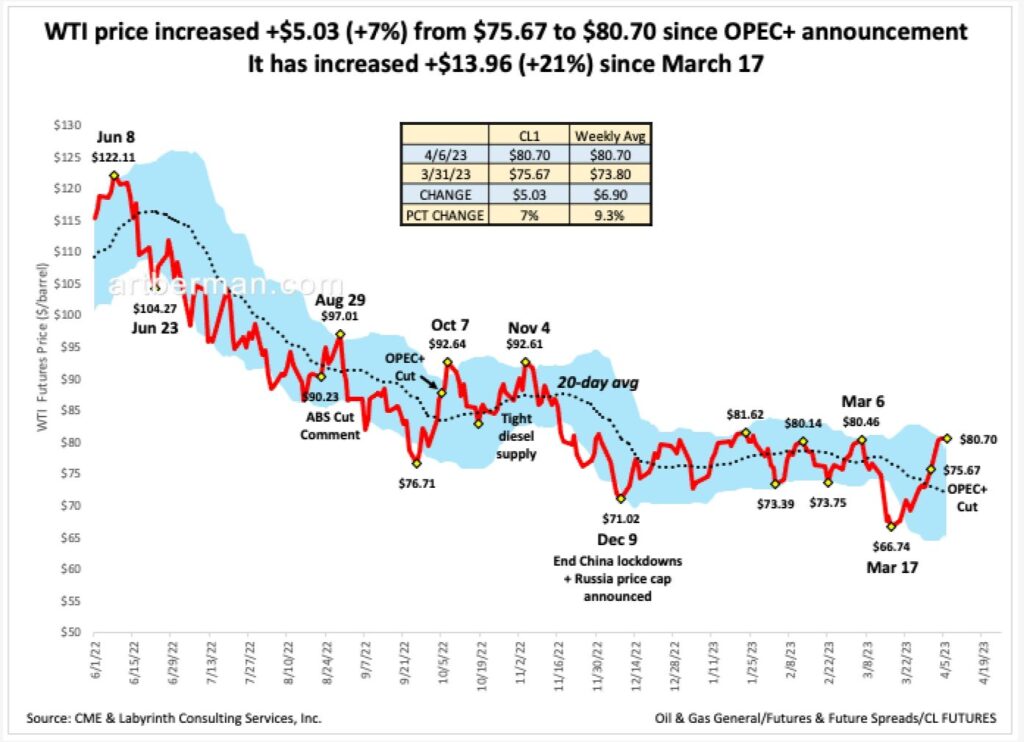
Price is about $5.00 (+7%) higher since the OPEC+ announcement on April 2. It has increased +$13.96 (+21%) since March 17. (Figure 1). Price is also at the upper limit of the blue-shaded Bollinger bands that represent two standard deviations above and below the 20-day moving price average (dashed black line). That suggests that WTI is over-bought. Whenever price has reached that limit since early June, it has been followed by a decrease.
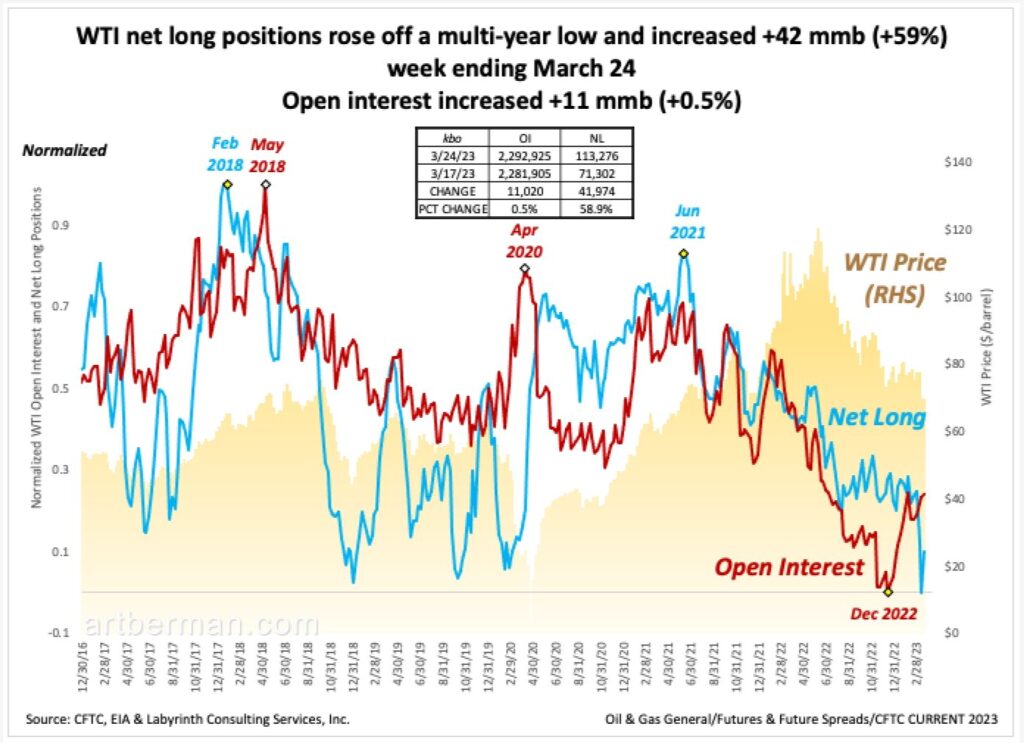
The timing of the production cut was peculiar because it was announced over a weekend. WTI net long positions had just moved off a multi-year low (Figure 2). OPEC+’s action and its timing caught those holding 80 mmb of short positions off guard. OPEC leadership routinely blames “speculators” for interfering in the oil markets that it customarily interferes with. Now, OPEC is punishing those traders who had been shorting oil.
“The supply cuts have thrown short sellers under the bus.”
Jessica Amir, Saxo Capital Markets
Most analyst reactions are driven by the expected effect of the export cuts to the world liquids supply-demand balance.
“The announced cut would further tighten an already fundamentally tight oil market, driving the Brent benchmark towards $100 per barrel sooner than previously expected and would push the price to around $110 per barrel this summer.”
Rystad Energy
This idea of a fundamentally tight oil market is such a part of the mainstream analyst narrative that it has become an assumed fact, and is rarely questioned or tested against price performance.
Figure 3, however, shows OPEC and EIA supply, demand and supply-demand balance through 2023. Two things are immediately obvious.
First, supply and demand have not recovered to the 35-year trend line since their decreases during the 2020 Covid pandemic. That is a problem that continues to vex OPEC and is essential to understanding its output cuts this month and in October 2022.
Second, the supply-demand deficits for the second half of 20213 do not appear to justify the fundamentally tight market narrative. Those projected balances, in fact, suggest approximate market balance and much smaller potential deficits than those in 2021.

Supply and demand are at best gross estimates. It is impossible to integrate every nation’s production, consumption and exports into a single framework. The data simply doesn’t exist. More importantly, supply and demand are transactional factors that largely exclude storage.
That’s right. Storage is not part of supply in the supply-demand paradigm. It is part of demand. Go figure.
Production equals supply in that model. Demand equals consumption plus net imports minus storage withdrawals. That’s like saying that someone’s net worth consists only of his salary, and does not include investments and savings except when withdrawals are made from them.
Price formation in oil markets, however, is almost exclusively focused on supply, and inventories are a big part of supply. Demand is of course important but markets cannot control demand. They can, however, use price as a lever to encourage drilling when there is concern about under-supply, and to discourage drilling when there is concern about over-supply.
Oil price is not an input factor for the supply-demand paradigm. It is deduced from the estimated change in the supply-demand balance.
I am not suggesting that analysts do not pay attention to storage volumes/inventory. They do but it is treated as an add-on factor used to support the outcome of the supply-demand evaluation.
The assumption that underlies the supply-demand model is fictional. It presumes that markets are ordinarily in equilibrium with occasional periods of dis-equilibrium. That is totally inconsistent with the physical reality of markets not to mention human life and the universe. Markets are never in equilibrium except in the human imagination.
This problem is strikingly similar to a parallel debate about the validity of neoclassical models for economics. The Cobb-Douglas production function only considers labor and capital as variables for economic output. The price and availability of energy and materials were only included later and to a very minimized extent (time code 19:00 to 21:00 minutes).
“The price theory assumes that there exist fixed and independent curves that describe supply and demand, but the reality is that these forces are coupled and in flux – and the idea that they lead to a stable and optimal equilibrium seems more than a little wobbly. The tenets of mainstream economics are made up, no more real than Medieval astronomers’ crystalline spheres.”
David Orrell
Oil markets are characterized by disequilibrium chiefly because drilling lags price. By the time a drilling decision is made, months or years follow before new supply reaches the market. By then, price is different, costs are different and demand is different. That is the producer’s dilemma.
Once the drilling decision is made, however, cash flow is critical even if it means losing money on every barrel produced because of the time value of money. Supply commonly overshoots demand as a result.
This scenario also applies in reverse. In fact, that is precisely what current discussions about under-investment by oil companies are about.
“Gross underinvestment in energy supply, encouraged by pressure from government, activists, investors and banks, has been a key driver of the energy crisis the world faces…Still, western energy majors’ annual investment plans remain roughly 15% below pre-pandemic levels, and the companies look steadfast in maintaining capital discipline in efforts to maximize free cash flow.”
The last eight years have been characterized by low oil prices. That period was punctuated by brief intervals when prices reached levels that justified drilling decisions but those didn’t last long enough to overcome future price risk. Critics of under-investment don’t seem to understand this.
The supply-demand oil-market paradigm before the recent OPEC+ action suggested that higher prices would probably occur later in the year.
“Our price forecast for $100 [Brent price]—that’s been there even before the OPEC cuts. Our view has been that the second half will be very bullish…Now with these OPEC cuts, that could come earlier potentially in late Q2.”
Amrita Sen, Energy Aspects
Sen’s forecasts have been consistently optimistic for price since at least 2018 largely because of her reliance on the supply-demand model.
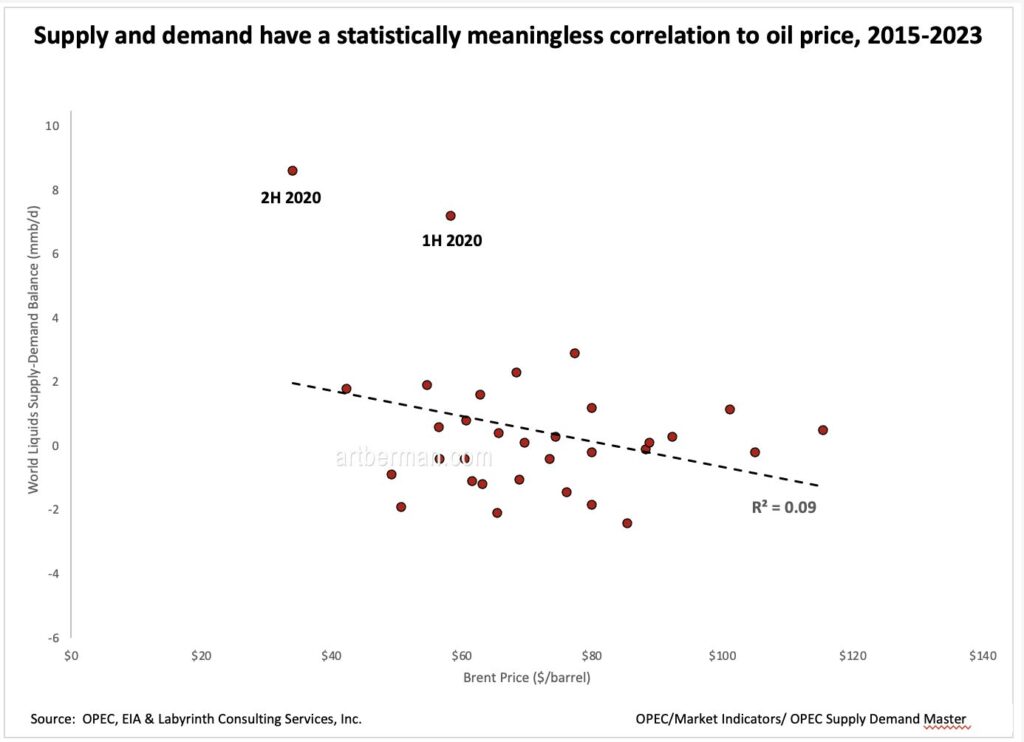
Figure 4 shows that the correlation of supply-demand balance and Brent oil price is a poor predictor of price. The R² correlation coefficient is 0.09. Leaving out the 2020 anomalies, R² gets worse and falls to 0.04. The correlation is almost statistically meaningless.
Comparative inventory (C.I.), on the other hand, assumes that oil is a mainly a disequilibrium system in which equilibrium is the exception rather than the rule. Crucially, the method uses inventory as a proxy for supply and price is a direct input.
Figure 5 shows that the correlation between U.S. comparative inventory and WTI price has an R² correlation coefficient of 0.72, a much more satisfying correlation than for supply and demand in Figure 4.
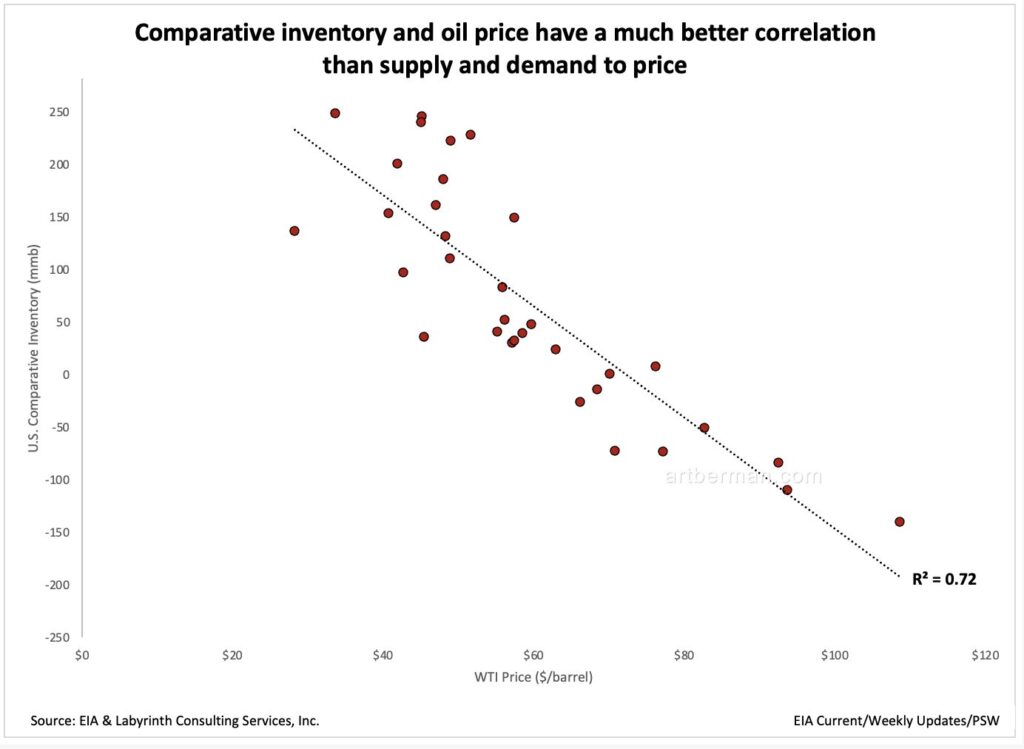
Comparative inventory suggests that higher oil prices are likely sooner than Amrita Sen has stated.
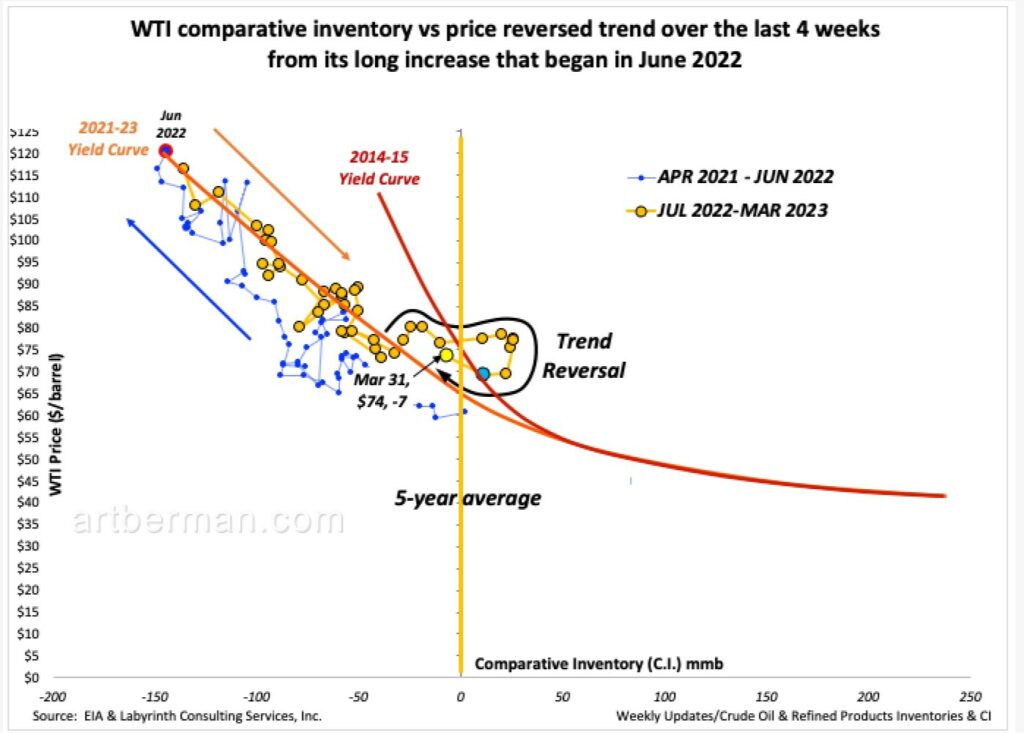
Figure 6 shows that the WTI comparative inventory vs spot price trend has reversed in the last four weeks. Since mid-June, 2022, comparative inventory had been increasing (gold arrow) and was more than the 5-year average in January and February of 2023.
That trend began to reverse (black arrow) in early March. C.I. became negative again for the week ending March 31 (yellow circle) with the biggest weekly decrease since 2006.
Overall, C.I. has fallen by 32 mmb in March. If that trend continues, WTI could easily reach $90/barrel in a few weeks especially considering the approximate $10 premium the market is giving to price because of its sense of supply urgency.
The elephant in the room, of course, is the economy and the effect of higher prices on demand.
“Demand destruction as function of the threat of recession is greater than the cut by OPEC+.”
Robert Yawger, Mizuho Securities
Oil analysts generally have a narrow focus and group external risks into broad and somewhat neutral categories like what Yawger calls “the threat of recession.”
I believe that these risks have a more immediate presence. I am less concerned about a recession than about the flight of investors and capital from oil markets and what seems to be a profound tightening of global credit markets. There is also what Morgan Stanley calls something “worse than in the Great Financial Crisis” for commercial real estate.
Then there is the war in Ukraine. We have reached a state with that conflict that Chuck Watson calls risk homeostasis. We understand but minimize its potential for disruption because the energy and materials crisis that rocked the world last year has subsided for now. That risk includes a nuclear exchange.
I do not mention these threats to be pessimistic. After all, I just stated a more optimistic call on oil prices than most mainstream analysts.
If we have learned anything over the last several years from Covid and the war in Ukraine it should be that the real global macro for low probability-high impact events seems to be greater than we previously thought possible.
Like Art's Work?

Share this Post:
Read More Posts