Fact-Checking the DUC Meme: Mostly False

Drilled uncompleted wells saved the shale patch during COVID. That’s the popular explanation.
The story is that so many wells were drilled in the boom years that many remained finished and only awaited fracking to produce. Producers relied heavily on these DUCs in the lean period during and immediately after COVID so they did not have to drill many new wells.
The problem with the story is that it’s mostly false. It’s a meme.
The True Part of the DUC Story
There is, of course, some truth to the story. Permian DUCs decreased from 3,601 in July 2020 to the 2015-2016 average of 1,131 by mid-2020 (Figure 1). That corresponded to a 70% drop in rig count (blue line in Figure 1). Production growth (gray fill in Figure 1) continued because DUCs were being completed to add production that was not coming from new drilling.

The Rest of the Story
It’s a good story but a closer look shows that it’s not a very good explanation. The first problem with the meme is that most DUCs are part of the normal operational cycle of drilling and completing multiple wells on a pad.
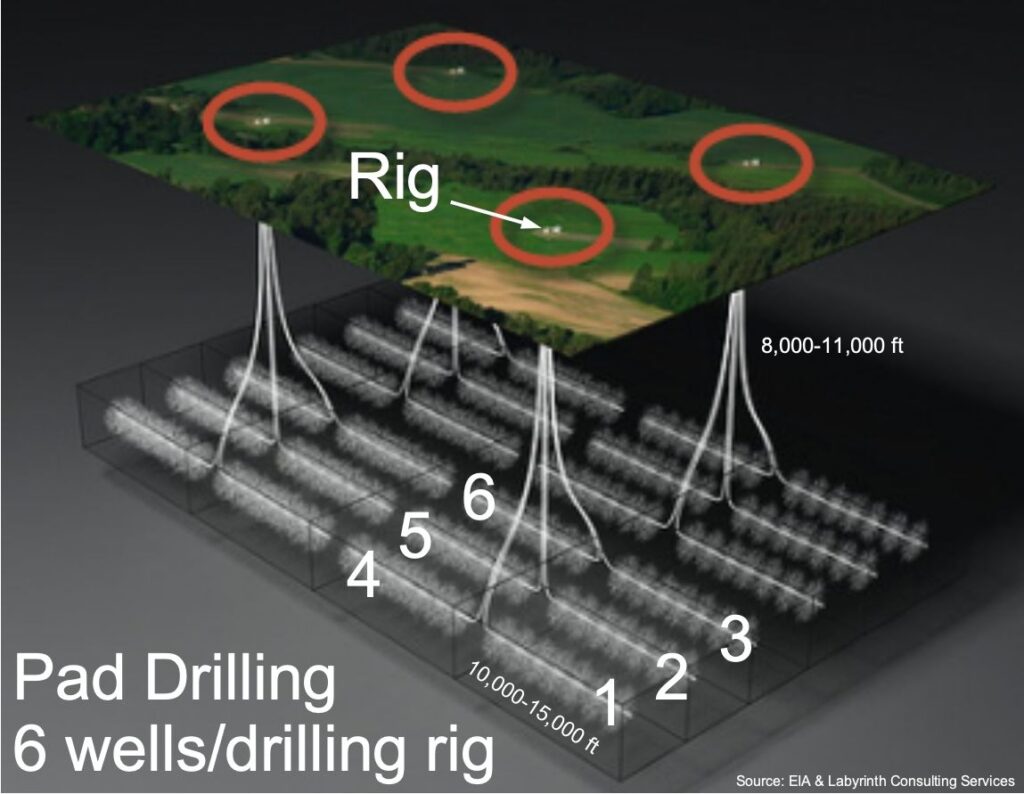
Figure 2 schematically shows a typical Permian basin pad-drilling configuration with 6 wells drilled from a single surface location. The average vertical depth is 8,000 to 11,000 feet, and the lateral length is 10,000 to 15,000 feet for wells drilled in the last few years.
A typical well in the Permian shale plays takes 7 months from well spud (the beginning of well drilling) to first production (Figure 3). That is about the time required to drill 6 wells on a pad, log, set pipe, cement, frack, test, and connect the wells to sales lines.

That blows a huge hole in the DUC meme. It suggests that a backlog of DUCs is normal, not extraordinary. It’s just what happens when many wells are drilled from a pad. It simply doesn’t make operational sense to frack until all wells on the pad are drilled. It takes time.
There is a second problem with the DUC meme. The variation in the number of DUCs over time turns out to be a function of frack crew availability (frack spread) and not some systematic strategy to complete certain wells first and others later.
Figure 4 shows the incremental number of Permian DUCs since 2018 and the U.S. frack spread. The increase and subsequent decrease of Permian DUCs since 2018 is inversely proportional to the number of frack crews (frack spread data is only publicly available for the entire U.S. but I am confident that the trend for the Permian basin is notionally similar).

That means that the increase in DUCs was because of a reduction in frack spreads beginning in mid-2018, and not because of the extraordinary number of wells that were drilled.
In fact, both Permian frack spreads and rig counts began to fall in mid-2018—almost two years before the COVID economic closure—probably reflecting decreased outside capital available to producers (Figure 5).

Data shows that the relationship between DUCs, the number of producing wells, and rig counts is much more complex than suggested by the mainstream DUC meme.
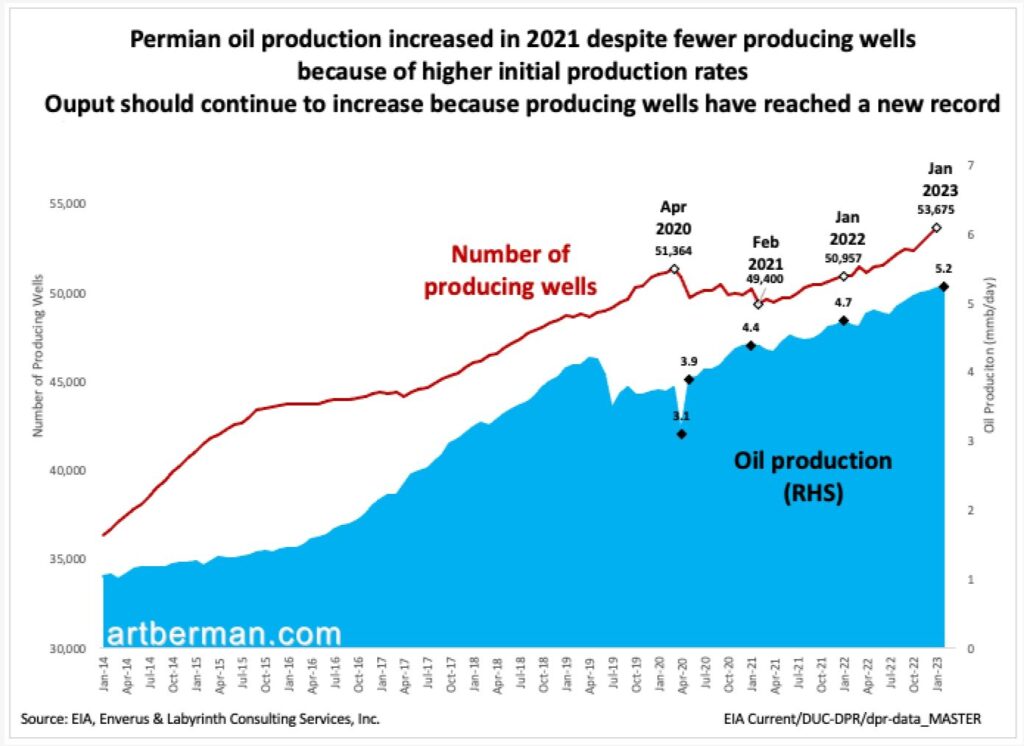
A third problem with the DUC meme is that it does not explain why Permian production continued to increase with fewer rigs, fewer frack spreads and fewer producing wells.
Production has climbed from 3.9 mmb/d in May 2020 to 5.2 mmb/d in January 2023 (Figure 6). This happened despite a decrease of 1,849 producing wells from April 2020 to April 2021.
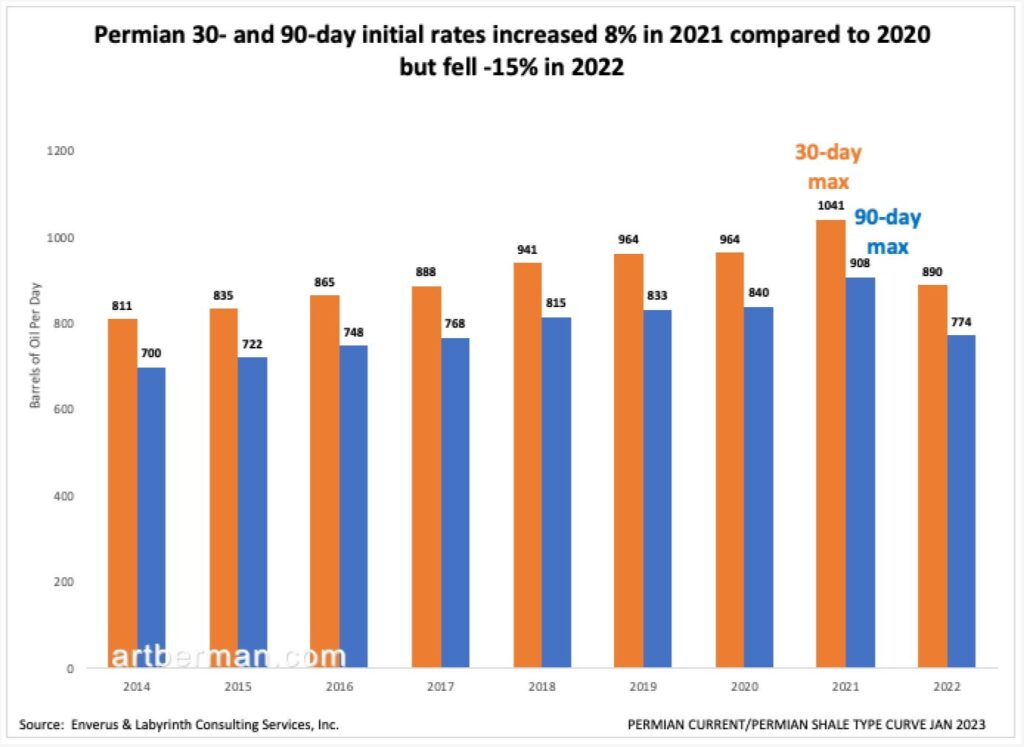
Permian 30- and 90-day initial rates increased 8% in 2021 compared to 2020 (Figure 7). That partly explains the problem of increased Permian oil production. Much of that is due to increased lateral lengths from an average of about 9,000 feet in 2018 and 2019 to almost 11,000 feet today.
Initial production rates have fallen in 2022 but the number of producing wells has increased to more than offset that loss in well performance.
Memes Are Irresistibly Dangerous
Memes have been a fixture of the information landscape since long before the internet existed. A meme is a shortened version of the Greek word mimeme. It is a self-replicating unit of memory, the smallest piece of information that a person can easily remember, the lowest common denominator of intelligence.
“When you plant a fertile meme in my mind you literally parasitize my brain, turning it into a vehicle for the meme’s propagation in just the way that a virus may parasitize the genetic mechanism of a host cell.”
Richard Dawkins, The Selfish Gene
A meme condenses a complex aspect of reality to a simplistic abstraction, something anyone can repeat in order to appear insightful and wise. No wonder people love them.
People want simple explanations for complex problems, and analysts with little oil industry background are eager to offer memes to fill their need. When enough analysts and media drones repeat the meme, it becomes conventional wisdom.
The DUC meme is a perfect example.
It is undeniably true that the number of DUCs has decreased since mid-2020. It is equally true that rig counts are much lower. Add the two together and the meme was born: companies are completing DUCs to make up for drilling fewer wells, and production continues growing as if nothing has happened. Case closed.
Unfortunately, it’s not that simple. It is a complex problem that has many related parts and feedback loops. It’s messy and requires data analysis and thought.
The analysis in this post goes a long way toward an explanation but leaves many questions either unanswered or with tentative answers. Welcome to the real world.
Human nature requires explanations and preferably simple ones. That is the appeal of memes. They are simultaneously irresistible and dangerous because their simplicity does not reflect reality but instead, some distortion that exists only in the human imagination.
If financial success were as simple as the memes that often guide investors, everyone would be rich.
Like Art's Work?

Share this Post:
Read More Posts