U.S. LNG: Global Power Play or Domestic Price Pain?

The U.S. has enough gas for LNG exports and domestic needs, but it’ll raise consumer prices, says a new DOE report. That’s like saying you’re healthy but staying alive will bankrupt you.
The report responded to Biden’s pause on new LNG export approvals, assessing their impact on greenhouse gas emissions. While LNG can cut emissions by replacing coal, it brings risks of methane leaks and energy-intensive processes like liquefaction and transport that add to emissions. Scenarios vary, but some show LNG exports driving significant increases in global greenhouse gas emissions.
Since the shale boom, oil and gas exports have become central to U.S. global power. Production has more than doubled since 2005, now 57% higher than the 1970 peak (Figure 1).
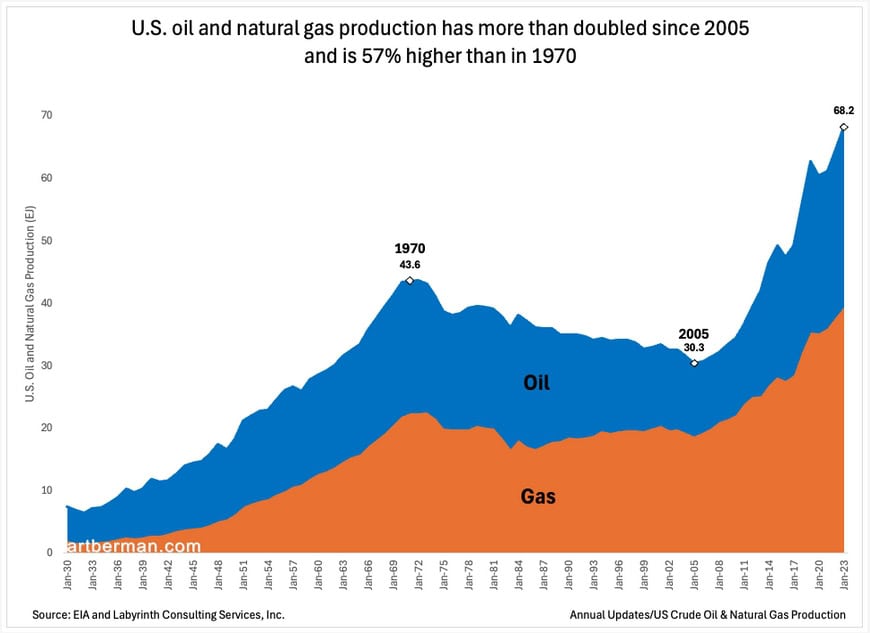
Modern power centers on oil—and increasingly, natural gas. U.S. geopolitical dominance grew from recognizing oil’s role early, and today, as the top producer of oil and gas, it’s leveraging that strength. Since the Obama administration, U.S. strategy has pushed gas exports and shale tech, with both Trump and Biden opposing Russia’s Nordstream II pipeline. After its 2022 sabotage, and Russia’s invasion of Ukraine, the U.S. became Europe’s key LNG supplier.
There are concerns that the LNG market faces likely oversupply in the coming years, with capacity set to surge 50% to 850 bcm by 2030, led by Qatar, the U.S., and new players. Demand is slipping in mature markets like Europe and Japan, while high prices and volatility deter emerging markets. The result? Oversupply, lower prices, and mounting financial risks for the sector.
U.S. natural gas prices were dirt cheap in 2024—high inventories and a mild winter cut demand, creating a supply glut. Europe, still adjusting to reduced Russian supply, paid higher prices, giving U.S. producers a profitable arbitrage. But that dynamic has shifted sharply in recent weeks.
Spot prices averaged just over $2.00 since February as storage swelled to decade-high levels, hitting a low of $1.50 in November (Figure 2). But a 58% drop in comparative inventory over two weeks has revived supply concerns, doubling gas prices.
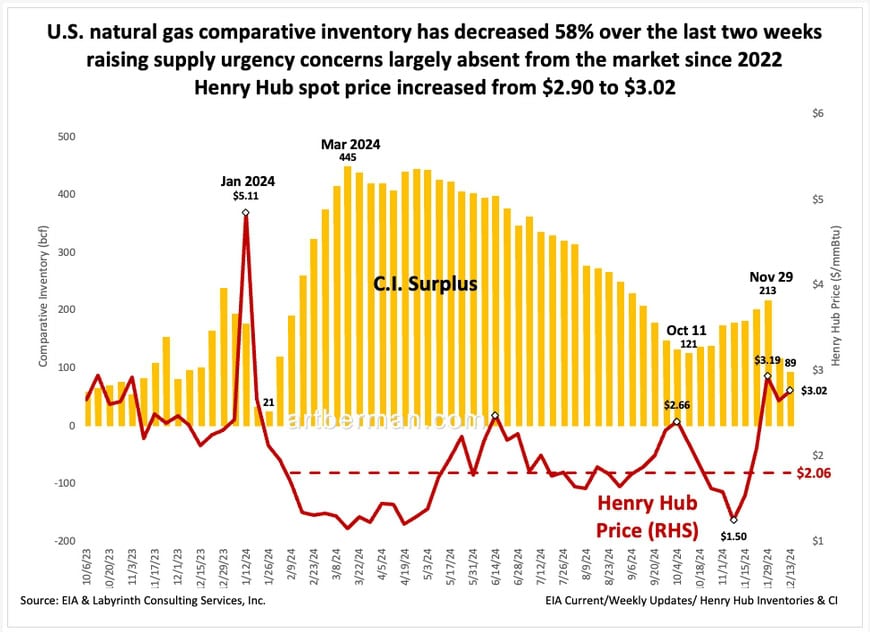
Source: EIA & Labyrinth Consulting Services, Inc.
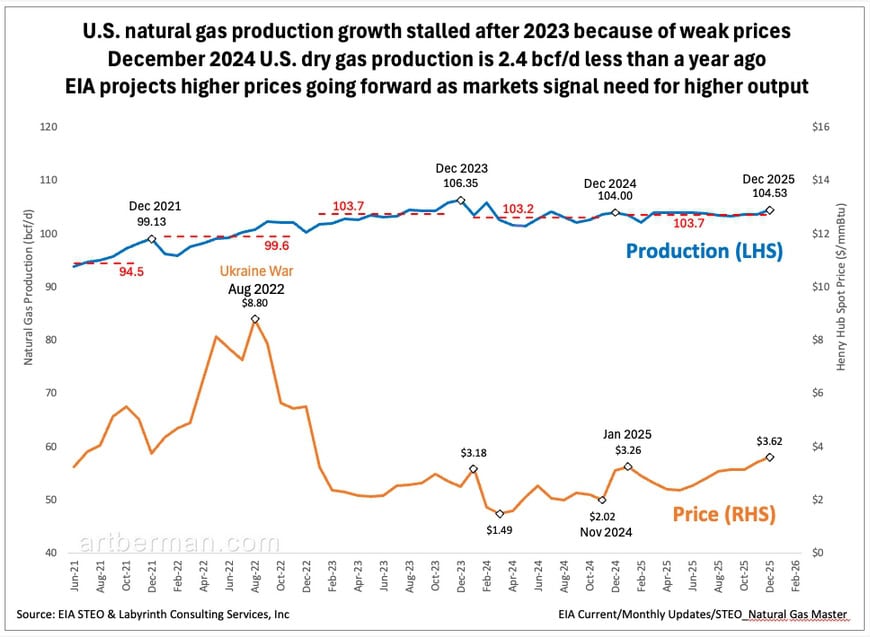
The main reason is that U.S. gas production stalled after 2023’s weak prices, with output now 2.4 bcf/d lower than last December (Figure 3). With inventories shrinking and no production growth, prices will rise until drilling picks up—something producers seem hesitant to do—despite the president-elect’s rhetoric.
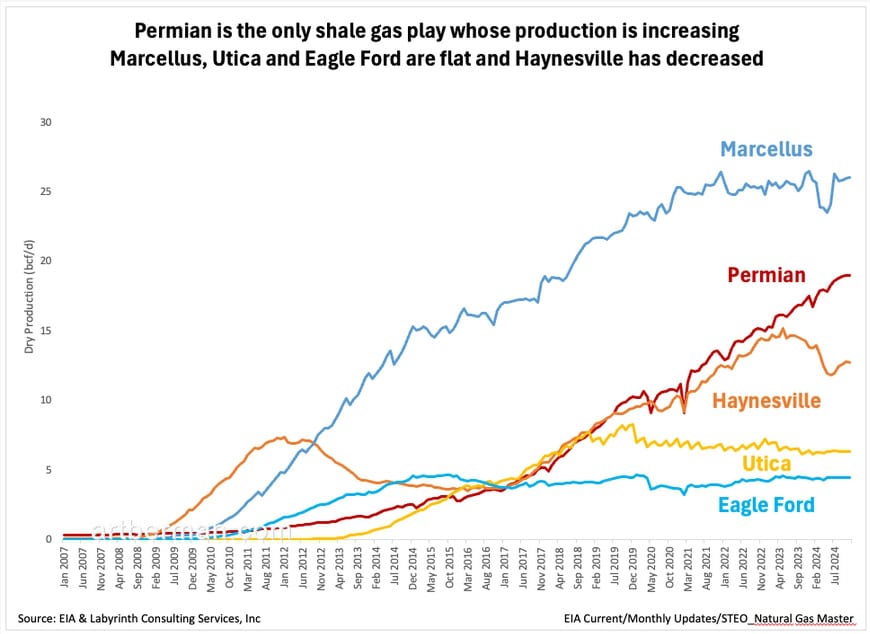
Nearly 80% of U.S. gas comes from shale plays (Figure 4), with 25% from Marcellus, 19% from Permian, and 13% from Haynesville (Figure 4).
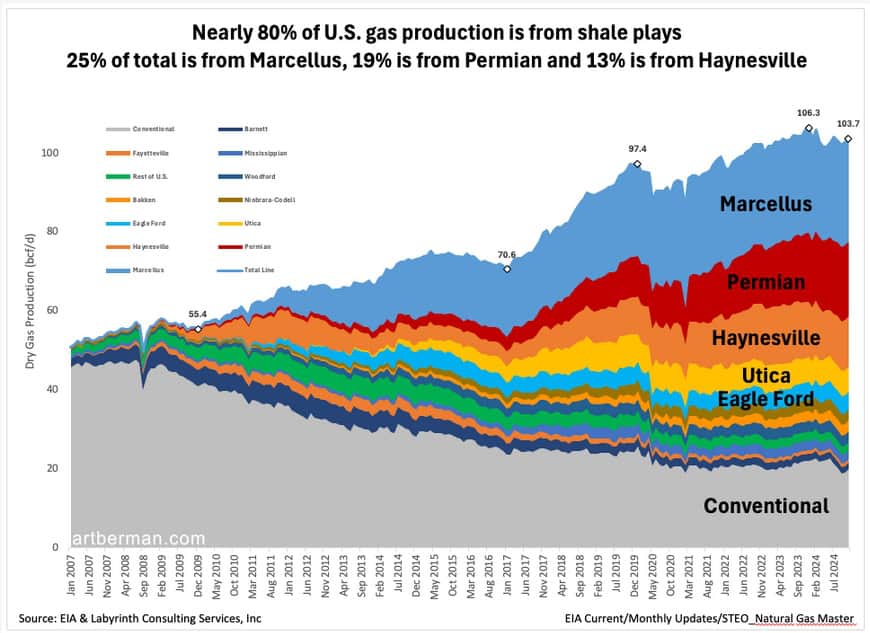
Source: EIA & Labyrinth Consulting Services, Inc.
Permian is the only shale gas play with rising production (Figure 5). Marcellus, Utica, and Eagle Ford are flat, while Haynesville is declining.
This isn’t about reserve depletion. The EIA’s 2022 assessment shows nearly 700 Tcf of proved reserves, over 60% from shale. Proved reserves likely underestimate the total that include probable and possible reserves, and the DOE is probably right that there’s enough gas for exports—if all else were equal. But all else isn’t equal.
Gas producers face the same dilemma as oil: rebuilding investor trust after the shale boom’s growth-at-any-cost strategy tanked margins and drove investors away.
Fund managers have been shorting U.S. natural gas since 2018 (Figure 6). As of December 13, NYMEX net long positions were 20 bcf (43%) below the 2022-24 average and 110 bcf (252%) below the 2017-21 average.
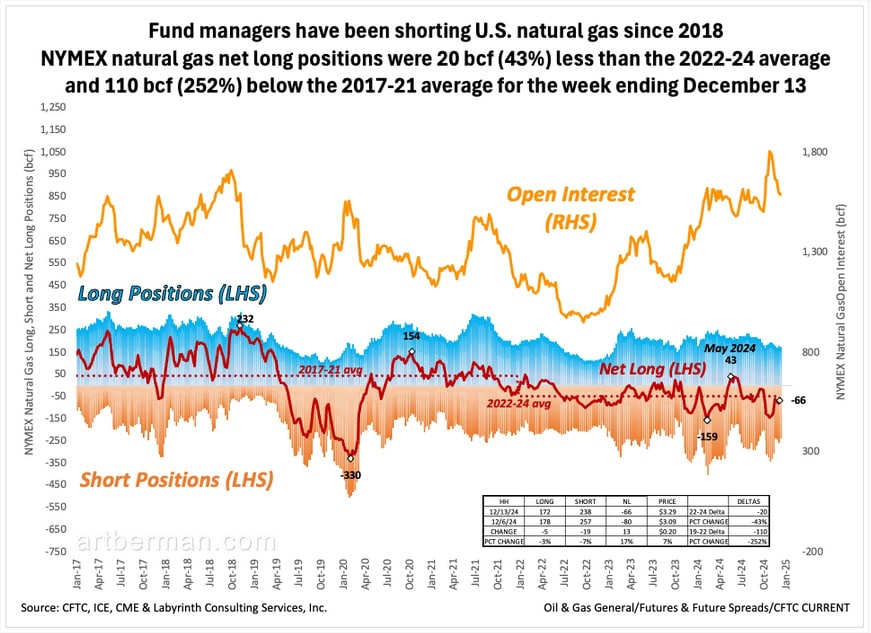
Source: CFTC, CME & Labyrinth Consulting Services, Inc.
They’re shorting oil too, signaling a broader bet against growth—logical since oil and gas still fuel over half of global energy. It doesn’t mean all growth is ending, but smart money is chasing high-return sectors, and energy, despite occasional bursts, isn’t one of them. Higher oil and gas prices used to mean more drilling, but that dynamic may not hold in today’s shifting energy and economic landscape. With LNG supply surging and demand growth slowing, oversupply looms—and that usually means lower prices.
On the other hand, AI’s growth is set to triple data center power demand by 2030, raising their share of U.S. electricity use from 3% to 8%. Meeting this surge may require $500 billion in new generation, with natural gas plants likely adding 3-6 Bcf/d in demand.
The DOE’s latest study raises questions. It leans on the EIA’s data from 2022—a year shaped by unusual energy demand from the post-Covid rebound and the shock of Russia’s invasion of Ukraine. It also ignores the market and capital hurdles of turning reserves into supply.
President-elect Trump issued the EU an ultimatum: buy more U.S. oil and gas to cut the trade deficit or face tariffs. “Make up your tremendous deficit with large-scale purchases,” he warned. “Otherwise, it’s TARIFFS all the way!”
Trump’s plan to boost oil and gas sales to Europe just shifts trade deficits, cutting sales elsewhere. Producers aren’t preparing for the surge he’s banking on. The EIA’s 2025 gas forecast is flat with 2023 and barely above 2024. Even if he strong-arms companies into action, the timing means any output bump won’t show until the tail end of his term.
LNG projects will add 6 Bcf/d in exports by 2030, blowing past the EIA’s gas production forecast by 55%. Companies win, consumers lose—so much for protecting average Americans. Gas prices have doubled in two weeks. That’s the beginning. Get ready for more pain.
Like Art's Work?

Share this Post:
Read More Posts
The last time we saw dramatic spikes in US natural gas prices not related to war in the early Aughts, we went nuts planning LNG import terminals. And coal made a comeback. The issue was price – which is how economics works to allocate scarce resources. Investors subsidized shale – and are subsidizing renewables. Attempts to keep the “headline number” low for electricity are reaching limits as the costs of grid expansion and backup power grow. Let’s see how much Big Tech is willing to pay for the PPA’s the developers of new gas fired power will be asking for to tie up gas supply for years.
Anne,
Many thanks for your thoughts.
I expect gas prices to increase for the reasons you suggest but LNG exports will add to the price pain. All the projections for Big Tech power expansion assume economic growth that can pay for it. All the projections for LNG export to Europe assume that the gas is affordable. The sensible option would be for Europe to return to cheaper Russian gas, and for America to reduce planned LNG exports or redirect them to Asian markets. Sensibility rarely manifests but, as you point out, economic pressure can sometimes make a difference.
All the best,
Art
Hi Art,
Goehring and Rozencwajg have implied in the graphs in their quarterly report published three weeks ago that total remaining reserves are likely to be around 525-550 TCF and their commentary is strongly bearish on recoverable supplies. Are they a fringe view in your estimation?
Gavin,
G&R’s charts are only for shale gas plays which only account for about two-thirds of total proven U.S. gas reserves. If your eye-ball estimate of 525-550 tcp is correct, that’s more optimistic than the EIA 431 tcf estimate for shale gas plays.
I’m not a big fan of Hubbert Linearization methods because they are a ratio of current production divided by cumulative production. An increasingly smaller numerator and an increasingly larger divisor will always give a pessimistic outcome. HL is fine for a quick-look but not more IMO. I’ve had recent discussions with Jean Laherrere on this topic and he agrees with me but sees no better approach.
All the best,
Art
hello Art
I think it would be illuminating to distinguish between reserves that exist in oil/gas accumulations that have not to date experienced productive activity (resources?) and those that have provided production. My multi-phase mathematics not to mention production histories (a nod to Morris Muskat is due don’t you think?) is that unit production starts low and guess what just keeps on rising. So hence my suggestion above. By the way how is the Red Queen performing these days(!)
Compliments of the Season Jim Pontin
Jim,
Proven reserves are by definition in existing accumulations. Probable are dominated by existing accumulations so I’m not really sure what you’re driving at here.
I have done reserve estimates since I was a graduate student and hats off to Darcy flow but it’s really about the production histories at the end of the proverbial day. Glad to hear more about the complex math part but high-school algebra, trig and a bit of elemenatary calculus are the basic tools behind the excel formulas IMO.
All the best,
Art
It seems the pump was primed with cheap capital and debt expansion in the early 2010s.
John,
Cheap capital was a factor 2000-2018 but supply urgency was the main factor.
All the best,
Art
700 trillion cubic feet of gas reserves is about 19 years consumption at 100 billion cfd. I’m sure there is some more gas out there not in presently counted reserves, but how many more years consumption can it be? At best, the oil and gas industry have only a few decades left. This is good for the climate, but building a whole civilization around stuff that’s going to run out in a few decades is folly. Why are people so short-sighted?
Joe,
The empirical counter-argument is that there have always been 10-20 years of reserves, and more are always found. It’s true. Doesn’t mean it will be true in the future but that’s the history.
All the best,
Art
The world’s oil field discoveries are rapidly declining.
Piao Liyang,
Don’t fall for the sell-side promoters.
There are 2 trillion barrels of proven oil reserves and at least an equal amount of resources. Geology is not the problem. Capital is.
All the best,
Art
Hi Art
Would that mean we have something like 50 years worth of oil available, but the limiting factor is the cost of extraction? Is that a problem with the availability of finance or is it related to the energy cost of getting the oil?
It seems we are getting caught in a pincer of sorts – efficiency has improved but is now reaching limits, while eroi is declining and is not bound, it can keep on declining. If we chart these factors it seems the space between them represents surplus which we have used for economic growth, but that gap is closing. As the gap closes and perhaps cross over then there is no longer surplus energy….then game over?
Cheers Derek
Derek,
The problem is the availability of capital for oil extraction. History suggests that supply urgency leads to higher price which in turn, causes more supply. I am not confident that correlation is as certain as in the past.
I suspect that credit markets will read oil its last rights, not geology.
EROI is an elegant concept with little practical application. Efficiency and technology are false Gods that only deliver if cost is ignored (which calls the definition of efficiency into question).
All the best,
Art
In the article you wrote in January, you argued that the U.S. reserves were likely overestimated and that there was insufficient supply, which led to your opposition to exports. However, in this article, it is suggested that the reserves are likely underestimated. What made you change your opinion?
Piao Liyang,
I see no contradiction between saying proved reserves are probably overestimated, and that total resources are likely greater than proved reserves.
All the best,
Art