Natural Gas: Winter Price Spike Won’t Break the Gloom

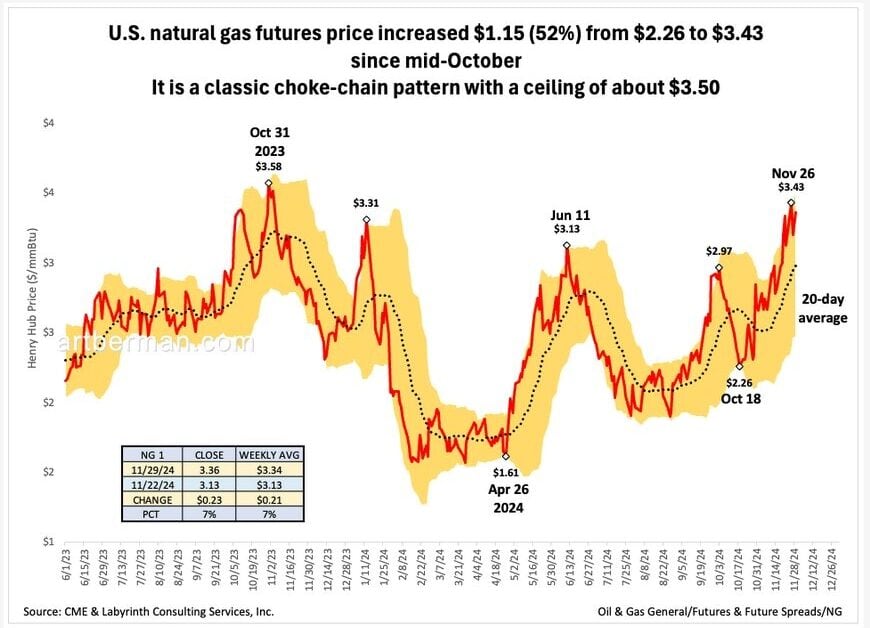
Natural gas prices jumped over 50% from $2.26 on October 18 to $3.43 on November 26, sparking talk of a rally. Don’t get too excited—this is winter weather at work, and the bigger picture is still grim.
Prices are locked in a choke-chain pattern with a ceiling around $3.50 (Figure 1). The last high was $3.58 on October 31, 2023, and before that, $3.59 almost two years ago on January 17, 2023. There’s little room for sustained price growth.
Weather drives gas demand and price, but inventory—especially comparative inventory (C.I.)—is what really matters. If inventory is adequate, weather might cause a price spike, but it won’t last. Only when inventory is low do weather patterns drive sustained price increases.
Comparative inventory (C.I.) moves inversely with price. A two-year C.I. surplus caps price gains (Figure 2). The January 2024 spike to $5.11 was weather-driven but short-lived—cold snaps don’t sustain prices when there’s a C.I. surplus.
Spot prices are used for C.I. instead of futures because that’s what producers actually receive. The weekly average spot price in Figure 2 was $2.35, compared to the $3.13 futures price for the same week in Figure 1. The difference? Futures reflect January delivery during peak winter demand, while the spot price is for last week’s delivery.
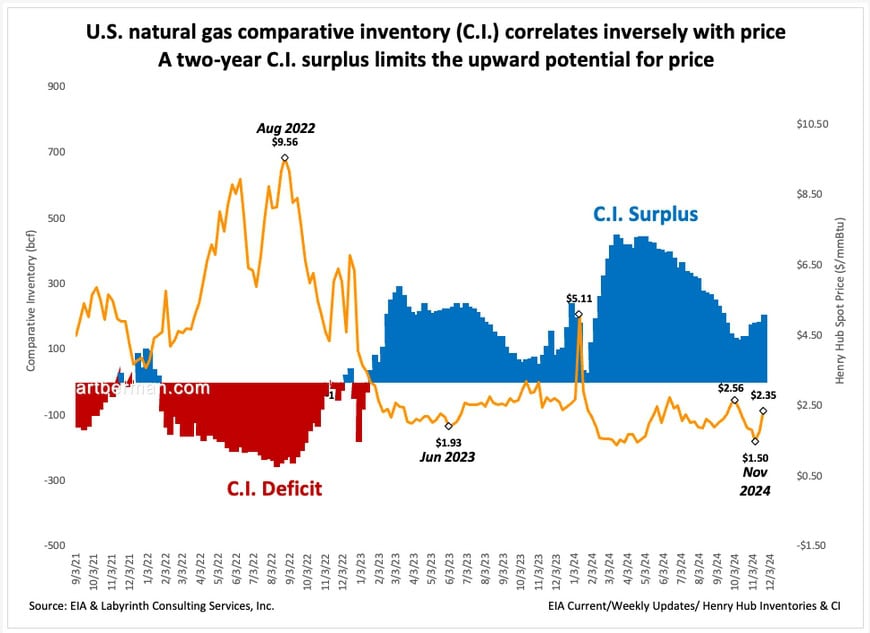
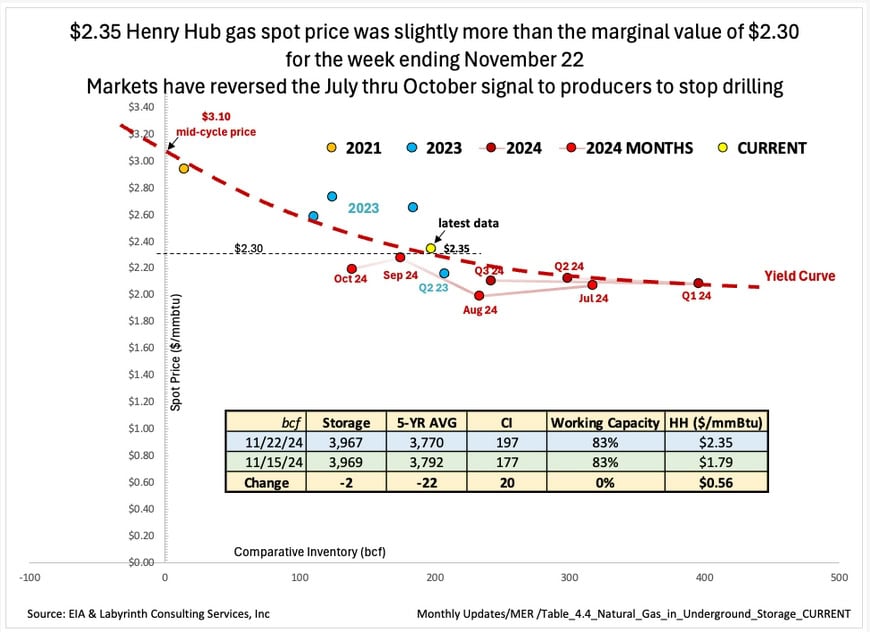
Figure 3 shows the same data but as a cross plot. The dashed red “yield curve” is similar to a bond yield curve. Instead of being a trend line between interest rate versus borrowing period, it correlates gas price with comparative inventory volume.
The $2.35 weekly average spot price sits just above the yield curve, reflecting the implied marginal price with a comparative inventory surplus of 197 Bcf above the 5-year average. Following the yield curve to the y-axis gives the “mid-cycle price” at the 5-year average—around $3.30.
In other words, even if inventory were drawn down by 200 Bcf, spot prices would only rise to $3.30. That’s a hard ceiling for bullish expectations. Markets don’t pay more than they have to for supply, no matter what we might hope.
Source: EIA & Labyrinth Consulting Services, Inc.
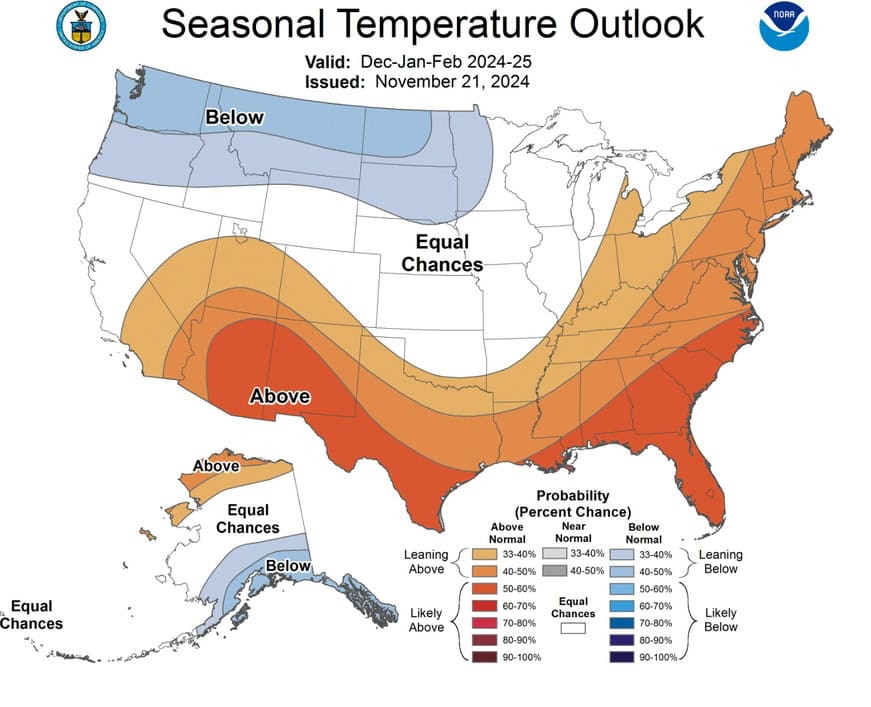
The seasonal outlook for December through February points to a relatively normal winter (Figure 4). Cold snaps are likely, but there’s no reason to think inventories won’t cover the demand. Markets are stingy and unlikely to justify higher gas prices without a real shortage.
For those counting on LNG exports to shift demand and prices, it’s already priced into the futures market. The only short-term impact would be negative if exports were reduced.
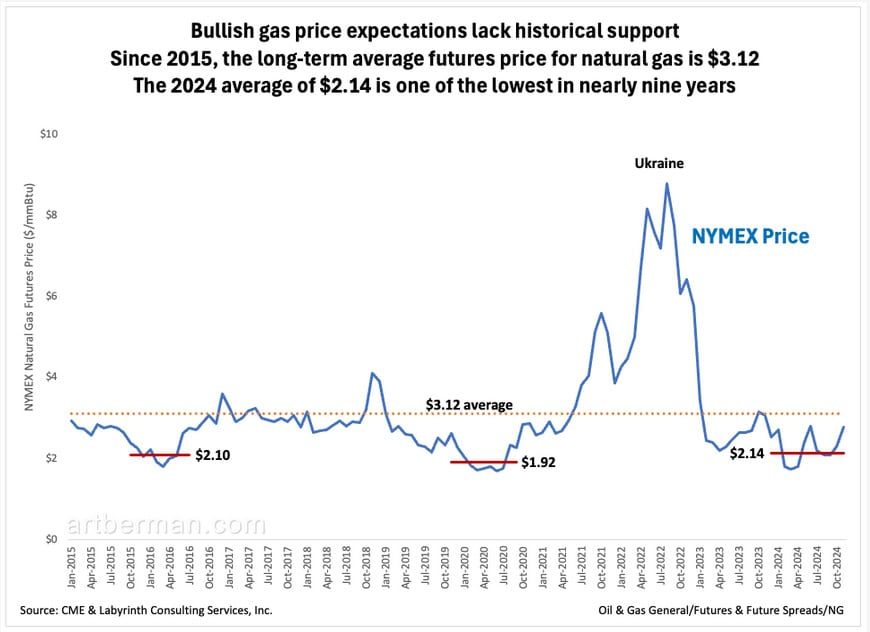
Bullish gas price expectations simply lack historical support. Since 2015, the long-term average futures price for natural gas is $3.12 (Figure 5). The 2024 average of $2.14 is one of the lowest in nearly nine years.
Natural gas bulls should take a hard look at the numbers. A 50% price jump sounds impressive, but it’s little more than winter weather noise. Inventories remain high, futures are already priced for optimism, and the market has a built-in ceiling around $3.50. Betting on sustained price increases in this environment isn’t just wishful thinking—it’s ignoring the fundamentals. The story here isn’t a rally; it’s a market stuck in a choke-chain, with little sign of breaking free.
Like Art's Work?

Share this Post:
Read More Posts
Interesting insight. Appreciate your comment on LNG. Could you also comment on natural gas demand increase due to Data Centers (AI)?
Thomas,
I’ve commented on that subject in several recent posts including this one: Blows to the Body Electric: AI meets Renewables–Renewables Lose
https://www.artberman.com/blog/blows-to-the-body-electric/
All the best,
Art
Perhaps if ‘drill baby drill’ actually works out by the new administration to ‘build (LNG terminals) baby build’…and export baby export…there will be an impact on comparative inventories…eventually??
John,
The Trump administration’s sloganeering is pure BS and his pick for Energy Secretary knows it (I had dinner with him recently). Draining America first is wholly inconsistent with America First.
All the best,
Art
Thanks Art!
Your welcome, Arch!
Thanks for your great insight. Gas demand has increased by more than 20% over the past 5 years.
Shouldn’t the relationship between inventory and price be discussed in terms of inventory days and price?
Disagree. I have learned to use comparative inventory over many decades, Naoki. You are welcome to use whatever approach you prefer.
All the best,
Art